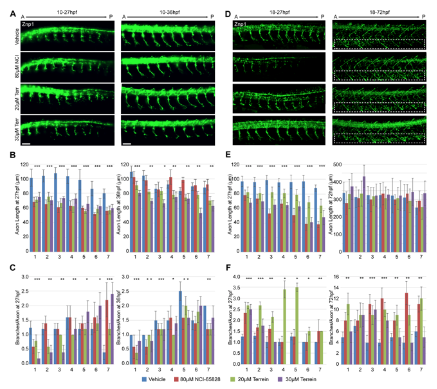
Fig. S1
Quantification of neuronal defects in terrein treated zebrafish
(a) Immunostaining for Znp1 in Fli:GFP zebrafish treated with Terrein or NCI65828 from 10hpf and observed at 27 or 36 hpf. (b) Immunostaining for Znp1 in Fli:GFP zebrafish treated with terrein or NCI65828 from 18 hpf and observed 27 or 72 hpf. (b) Quantification of primary motor neuron axon length at the indicated time after treatment from 10hpf. (c) Quantification of primary motor neuron branching at the indicated time after treatment from 10 hpf. (d) Immunostaining for Znp1 in Fli:GFP zebrafish treated with Terrein or NCI-65828 from 18 hpf to 27 or 72 hpf. (e) Quantification of primary motor neuron axon length at the indicated time after treatment from 18 hpf. (f) Quantification of primary motor neuron branching at the indicated time after treatment from 18 hpf. Scale bars 50µm. Error bars SEM. * = P<0.05. Quantification made of seven motor axon projections on the left side (1-7, anterior to posterior) above the yolk sac extension from two replicate experiments of ten embryos each.

