
Image
|
Figure Caption
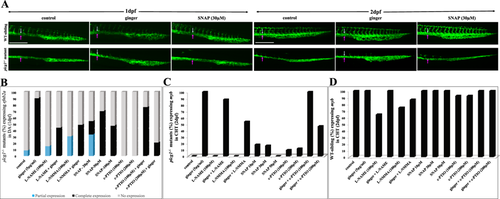
Fig. 6
Effects of nitric oxide on arterial and hematopoietic gene marker expression. (A) Vasculature visualized by tg(fli1:GFP)at 1 dpf and 2 dpf embryos. (B–D) The graphical results are shown in 1 dpf (B) and 2 dpf (C,D) embryos. NO synthase inhibitors L-NAME and L-NMMA, NO donor SNAP, and NO scavenger c-PTIO. White arrow indicates dorsal aorta and pink arrow indicates cardinal vein. Scale bars = 250 μm.
Acknowledgments
This image is the copyrighted work of the attributed author or publisher, and
ZFIN has permission only to display this image to its users.
Additional permissions should be obtained from the applicable author or publisher of the image.
Full text @ Sci. Rep.