
Image
|
Figure Caption
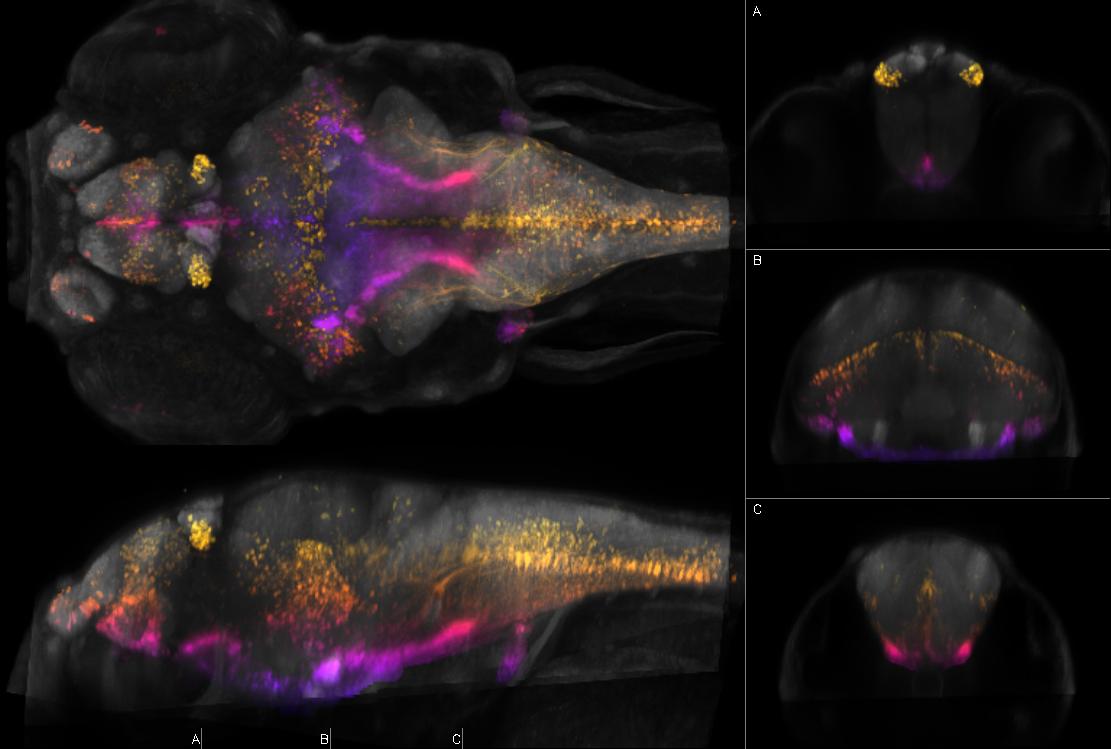
Fig.86 Left: dorsal and sagittal maximal confocal projections from Zebrafish Brain Browser. Right: coronal slices at the indicated levels. Depth coded by color. Intensity represents mean expression in larvae transgenic for y417Et and Tg(UAS:Kaede)s1999t which expresses Kaede in olfactory epithelium, telencephalon (ventral midline), lateral habenula, optic tectum, medulla oblongata, vagal ganglion, heart (strong), intestine (strong), somite boundaries, neuromasts (head only)
Figure Data