
Image
|
Figure Caption
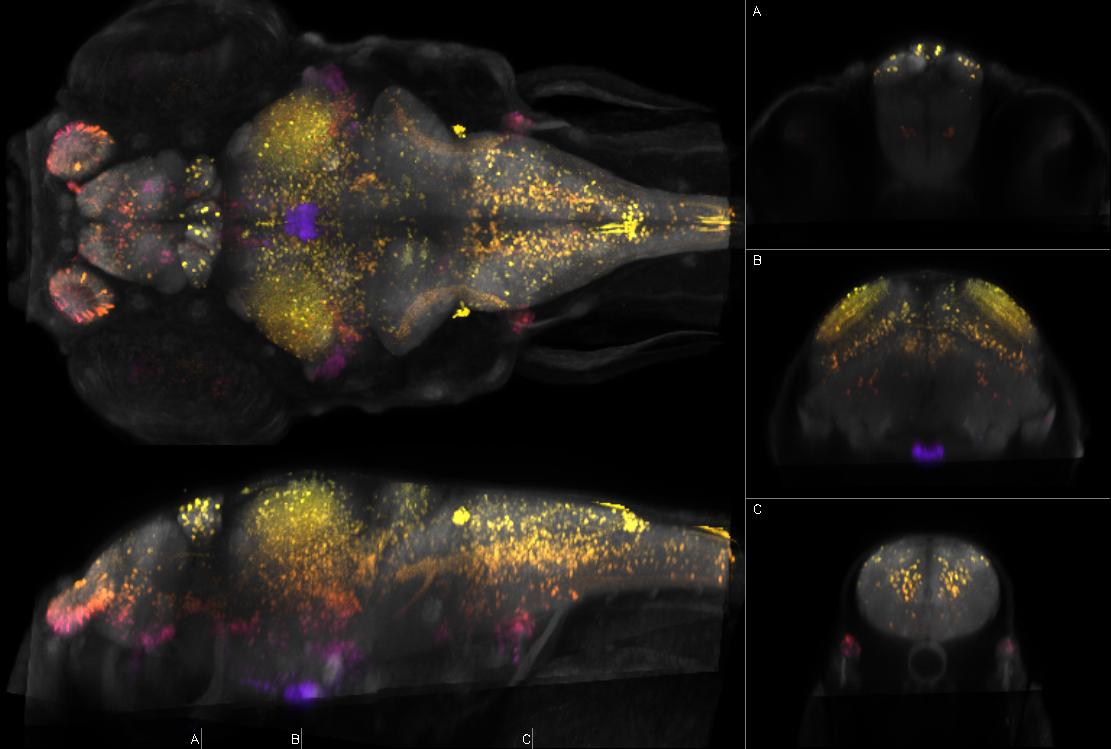
Fig.79 Left: dorsal and sagittal maximal confocal projections from Zebrafish Brain Browser. Right: coronal slices at the indicated levels. Depth coded by color. Intensity represents mean expression in larvae transgenic for y325Et and Tg(UAS:Kaede)s1999t which expresses Kaede in olfactory sensory neurons, posterior tuberculum, optic tectum, pituitary, reticulospinal neurons, trigeminal ganglion, aLLg, pLLg, neuromasts (strong; head and trunk), medulla (caudal/dorsal and longitudinal stripe), otic vesicle maculae, retinotectal tract, spinal cord, endocrine pancreas, fast muscle
Figure Data