
Image
|
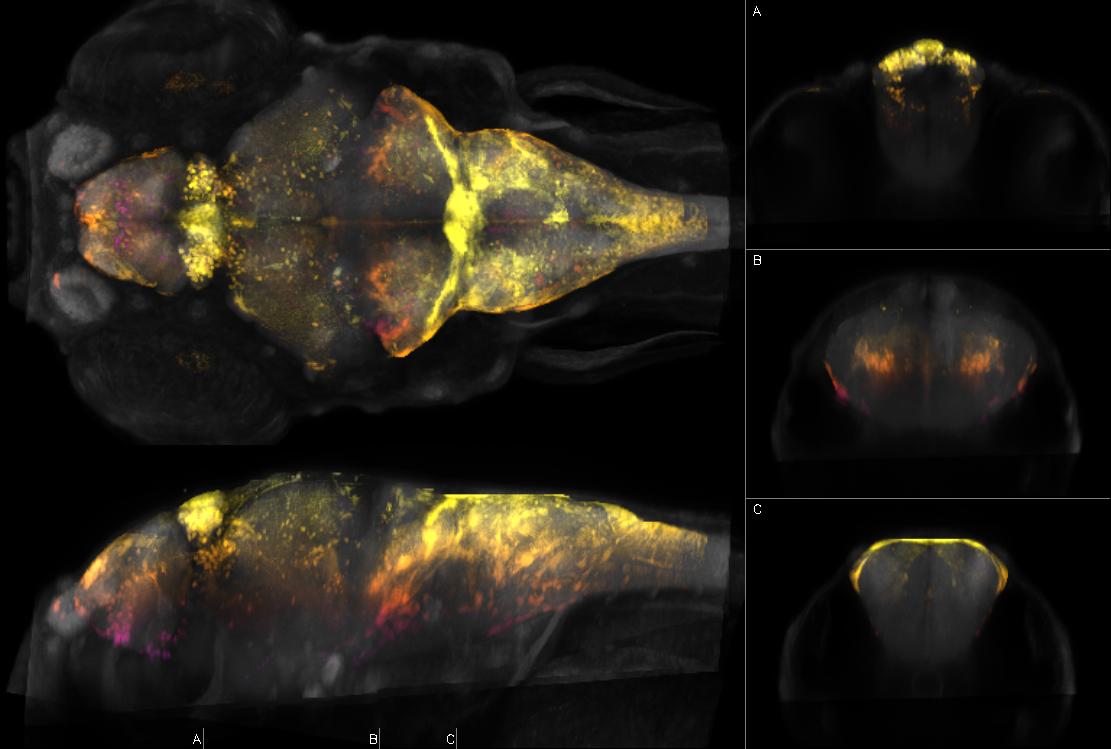
Figure Caption
Fig.52 Left: dorsal and sagittal maximal confocal projections from Zebrafish Brain Browser. Right: coronal slices at the indicated levels. Depth coded by color. Intensity represents mean expression in larvae transgenic for y242Et and Tg(UAS:Kaede)s1999t which expresses Kaede in olfactory bulb, subpallium, habenula, pineal, pretectum, locus coeruleus, medulla oblongata, retina, spinal cord (radial glia), motor neurons, slow muscle (weak), integument (strong in patch dorsal to rhombomere 5), habenula, heart (weak)
Figure Data