
Image
|
Figure Caption
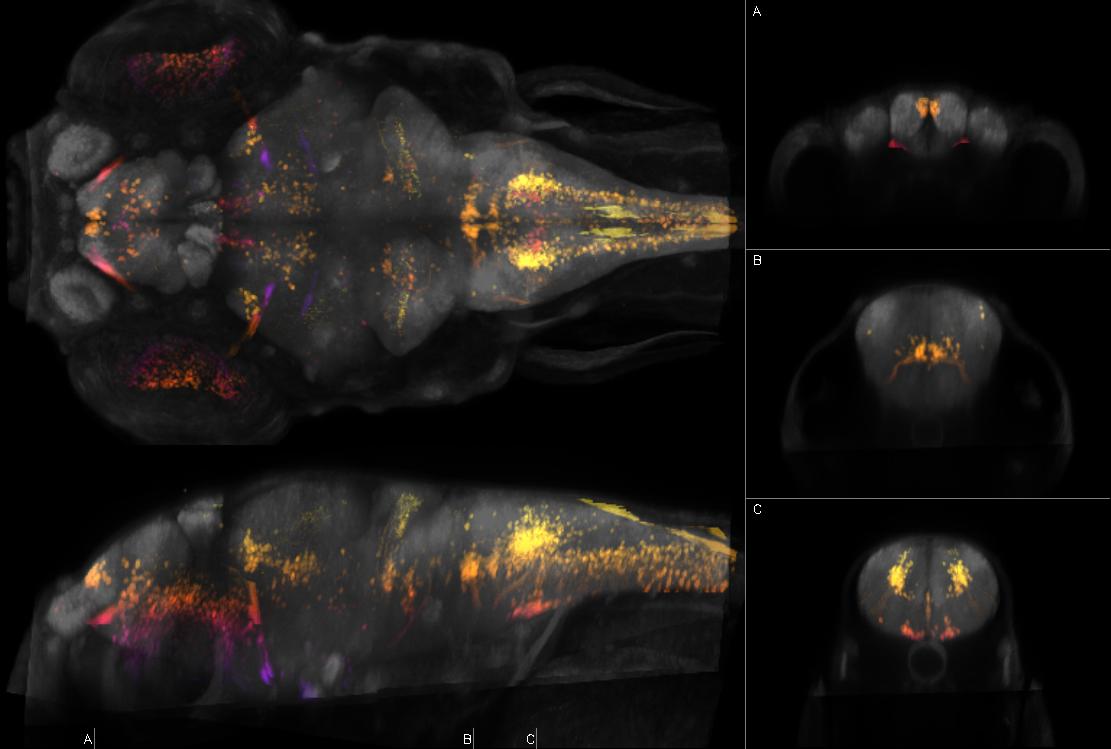
Fig.47 Left: dorsal and sagittal maximal confocal projections from Zebrafish Brain Browser. Right: coronal slices at the indicated levels. Depth coded by color. Intensity represents mean expression in larvae transgenic for y394Et and Tg(UAS:Kaede)s1999t which expresses Kaede in olfactory bulb, subpallium, posterior tuberculum, facial octavolateralis motor neurons, vagus motor neurons, inferior olive, motor neurons, ocular muscle, strong pectoral fin, yolk extension, weak slow muscle
Figure Data