
Image
|
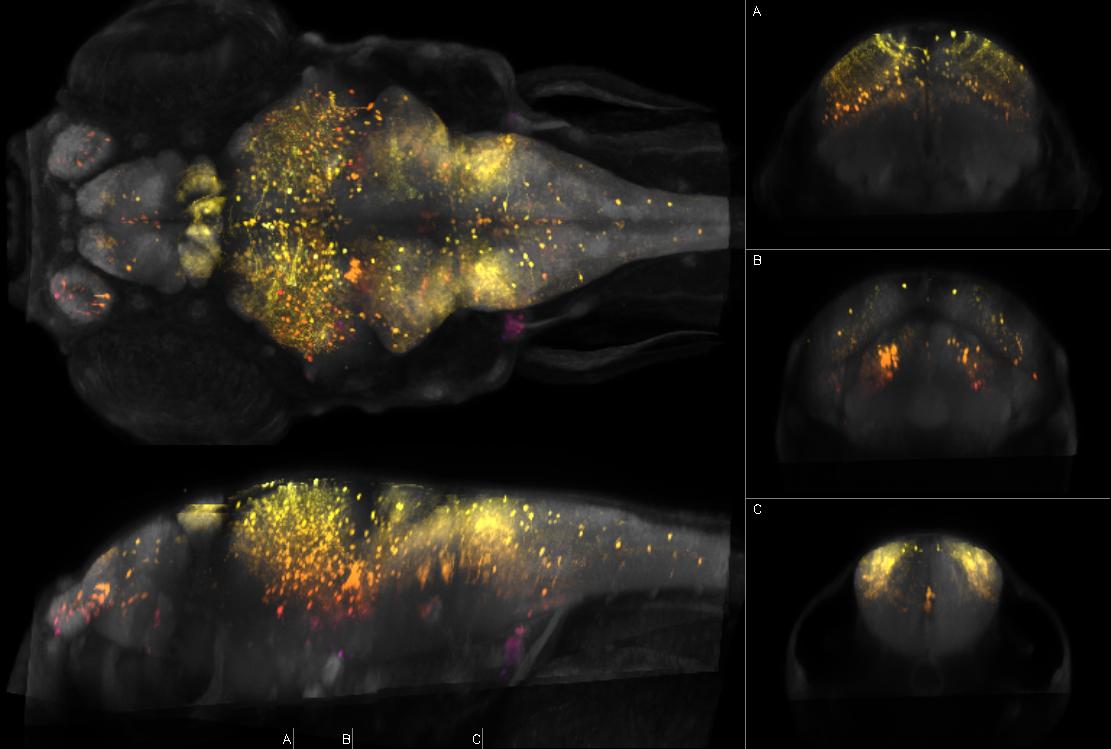
Figure Caption
Fig.40 Left: dorsal and sagittal maximal confocal projections from Zebrafish Brain Browser. Right: coronal slices at the indicated levels. Depth coded by color. Intensity represents mean expression in larvae transgenic for y576Et and Tg(UAS:Kaede)s1999t which expresses Kaede in pineal, optic tectum, corpus cerebelli, tegmentum, medulla oblongata (lateral domain), endocrine pancreas (weak), retina (strong), fast muscle (weak)
Figure Data