
Image
|
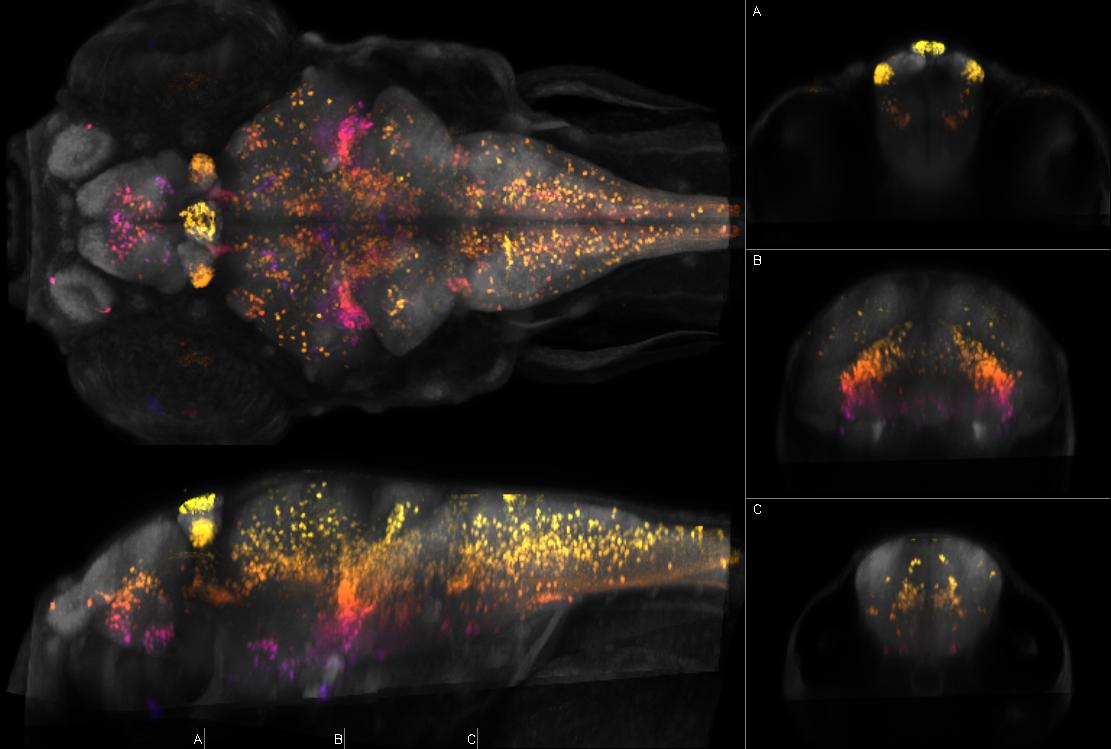
Figure Caption
Fig.22 Left: dorsal and sagittal maximal confocal projections from Zebrafish Brain Browser. Right: coronal slices at the indicated levels. Depth coded by color. Intensity represents mean expression in larvae transgenic for y375Et and Tg(UAS:Kaede)s1999t which expresses Kaede in subpallium, pineal complex, habenula (lateral;fasciculus retroflexus to below medial raphe), ventral thalamus, pituitary, medulla oblongata, Nuc MLF, medulla, motor neurons, retina, spinal cord, strong heart, weak ventral fin
Figure Data