
Image
|
Figure Caption
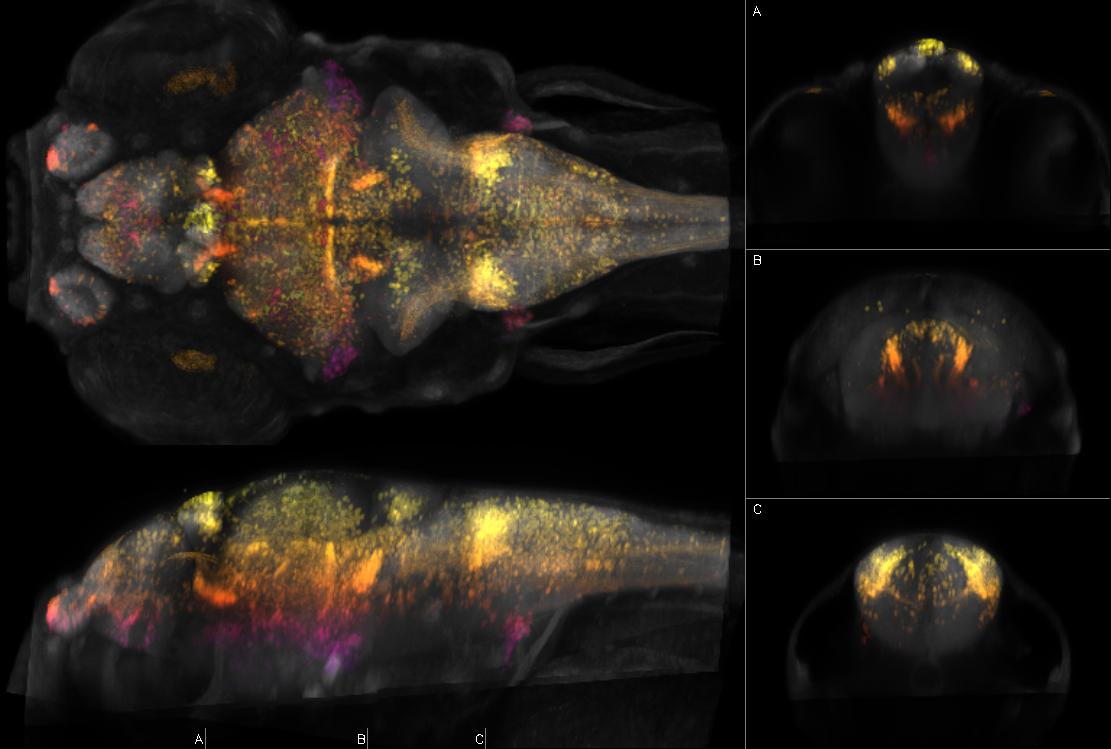
Fig.100 Left: dorsal and sagittal maximal confocal projections from Zebrafish Brain Browser. Right: coronal slices at the indicated levels. Depth coded by color. Intensity represents mean expression in larvae transgenic for y420Et and Tg(UAS:Kaede)s1999t which expresses Kaede in olfactory sensory neurons, hypothalamus - rostral zone, posterior tuberculum, tegmentum, medulla oblongata (rostral nuclei), aLLg, pLLg, lateral line, neuromasts, spinal cord, floorplate, blood
Figure Data