
|
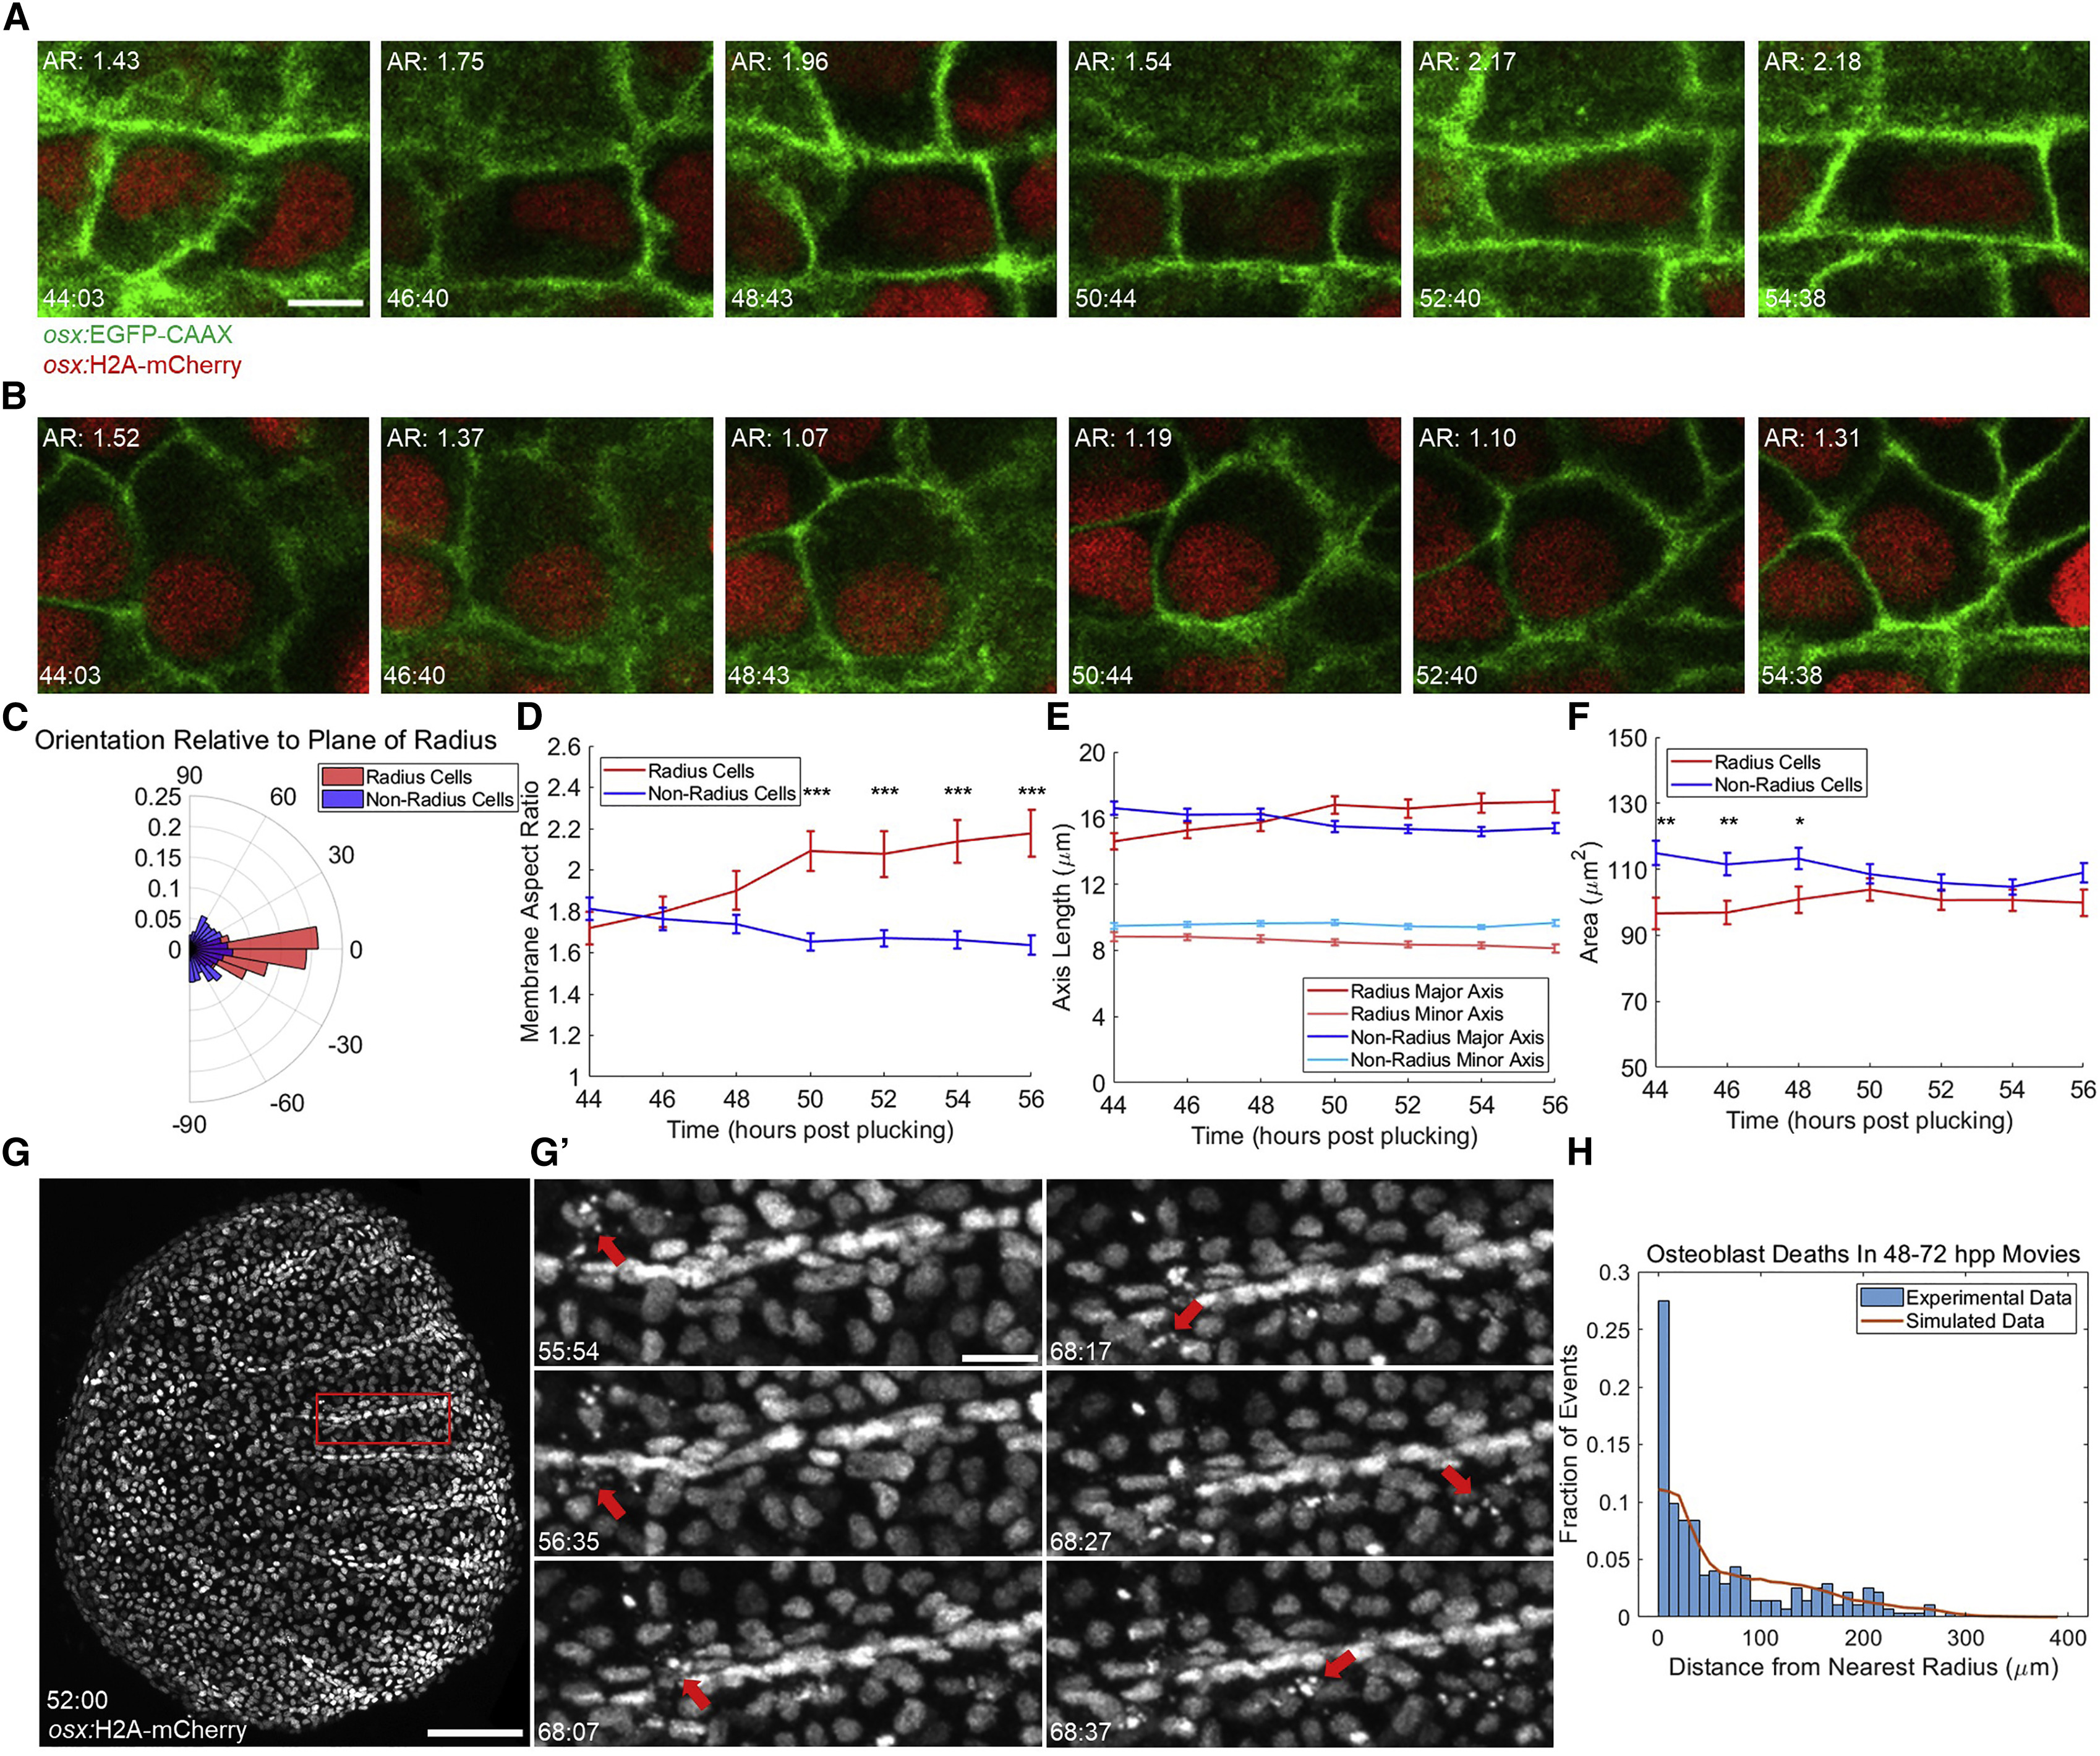
Fig. 5 Scale Radii Regenerate by Patterned Osteoblast Shape Changes and Cell Death Events (A and B) Individual tracked radius- (A) and non-radius-forming (B) osteoblasts during a 10-hr video, shown at approximately 2-hr intervals. (Top left of each) Membrane aspect ratio is shown. (Bottom left) Time post-plucking (hours:minutes) is shown. Scale bar represents 5 μm. (C) Polar histogram indicating orientation of the major axis of tracked osteoblasts to the plane of radius growth (n = 132 non-radial osteoblasts, 67 radial osteoblasts, imaged 10–12 hr). (D) Average membrane aspect ratio for radius- (red line) and non-radius-forming cells (blue line) over time. By 50 hpp, the aspect ratio of radius osteoblasts is significantly greater than non-radius osteoblasts. ∗∗∗p < 0.001. (E) Data from (D) decomposed into changes in length of major (darker shading) and minor (lighter shading) axes of radius (red) and non-radius cells (blue). (F) Changes in mean areas of radius and non-radius osteoblasts. Increases in radius cell area and decreases in non-radius cell area are not individually significant but result in loss of a significant difference between areas of radius and non-radius cells. ∗p <0.005; ∗∗p < 0.01. (G) A regenerating scale expressing osx:H2A-mCherry at 52 hpp, the first time point of a 20-hr video. Scale bar represents 100 μm. Error bars indicate ± SEM. (G’) Nuclear fragmentation (red arrows) at various times from the region outlined in (G) is depicted. Scale bar represents 20 μm. (H) Histogram of cell death data from three >20-hr videos spanning 48–72 hpp total. 273 hand-counted cell deaths were plotted by distance from the nearest radius (blue bars, bins of 10 μm). Observed data were compared to the results of 1,000 simulations of randomly placed cell deaths (273,000 random cell deaths, orange line).