
Fig. 4
- ID
- ZDB-IMAGE-190426-16
- Publication
- Cox et al., 2018 - In Toto Imaging of Dynamic Osteoblast Behaviors in Regenerating Skeletal Bone
- All Figures
- Figures for Cox et al., 2018
|
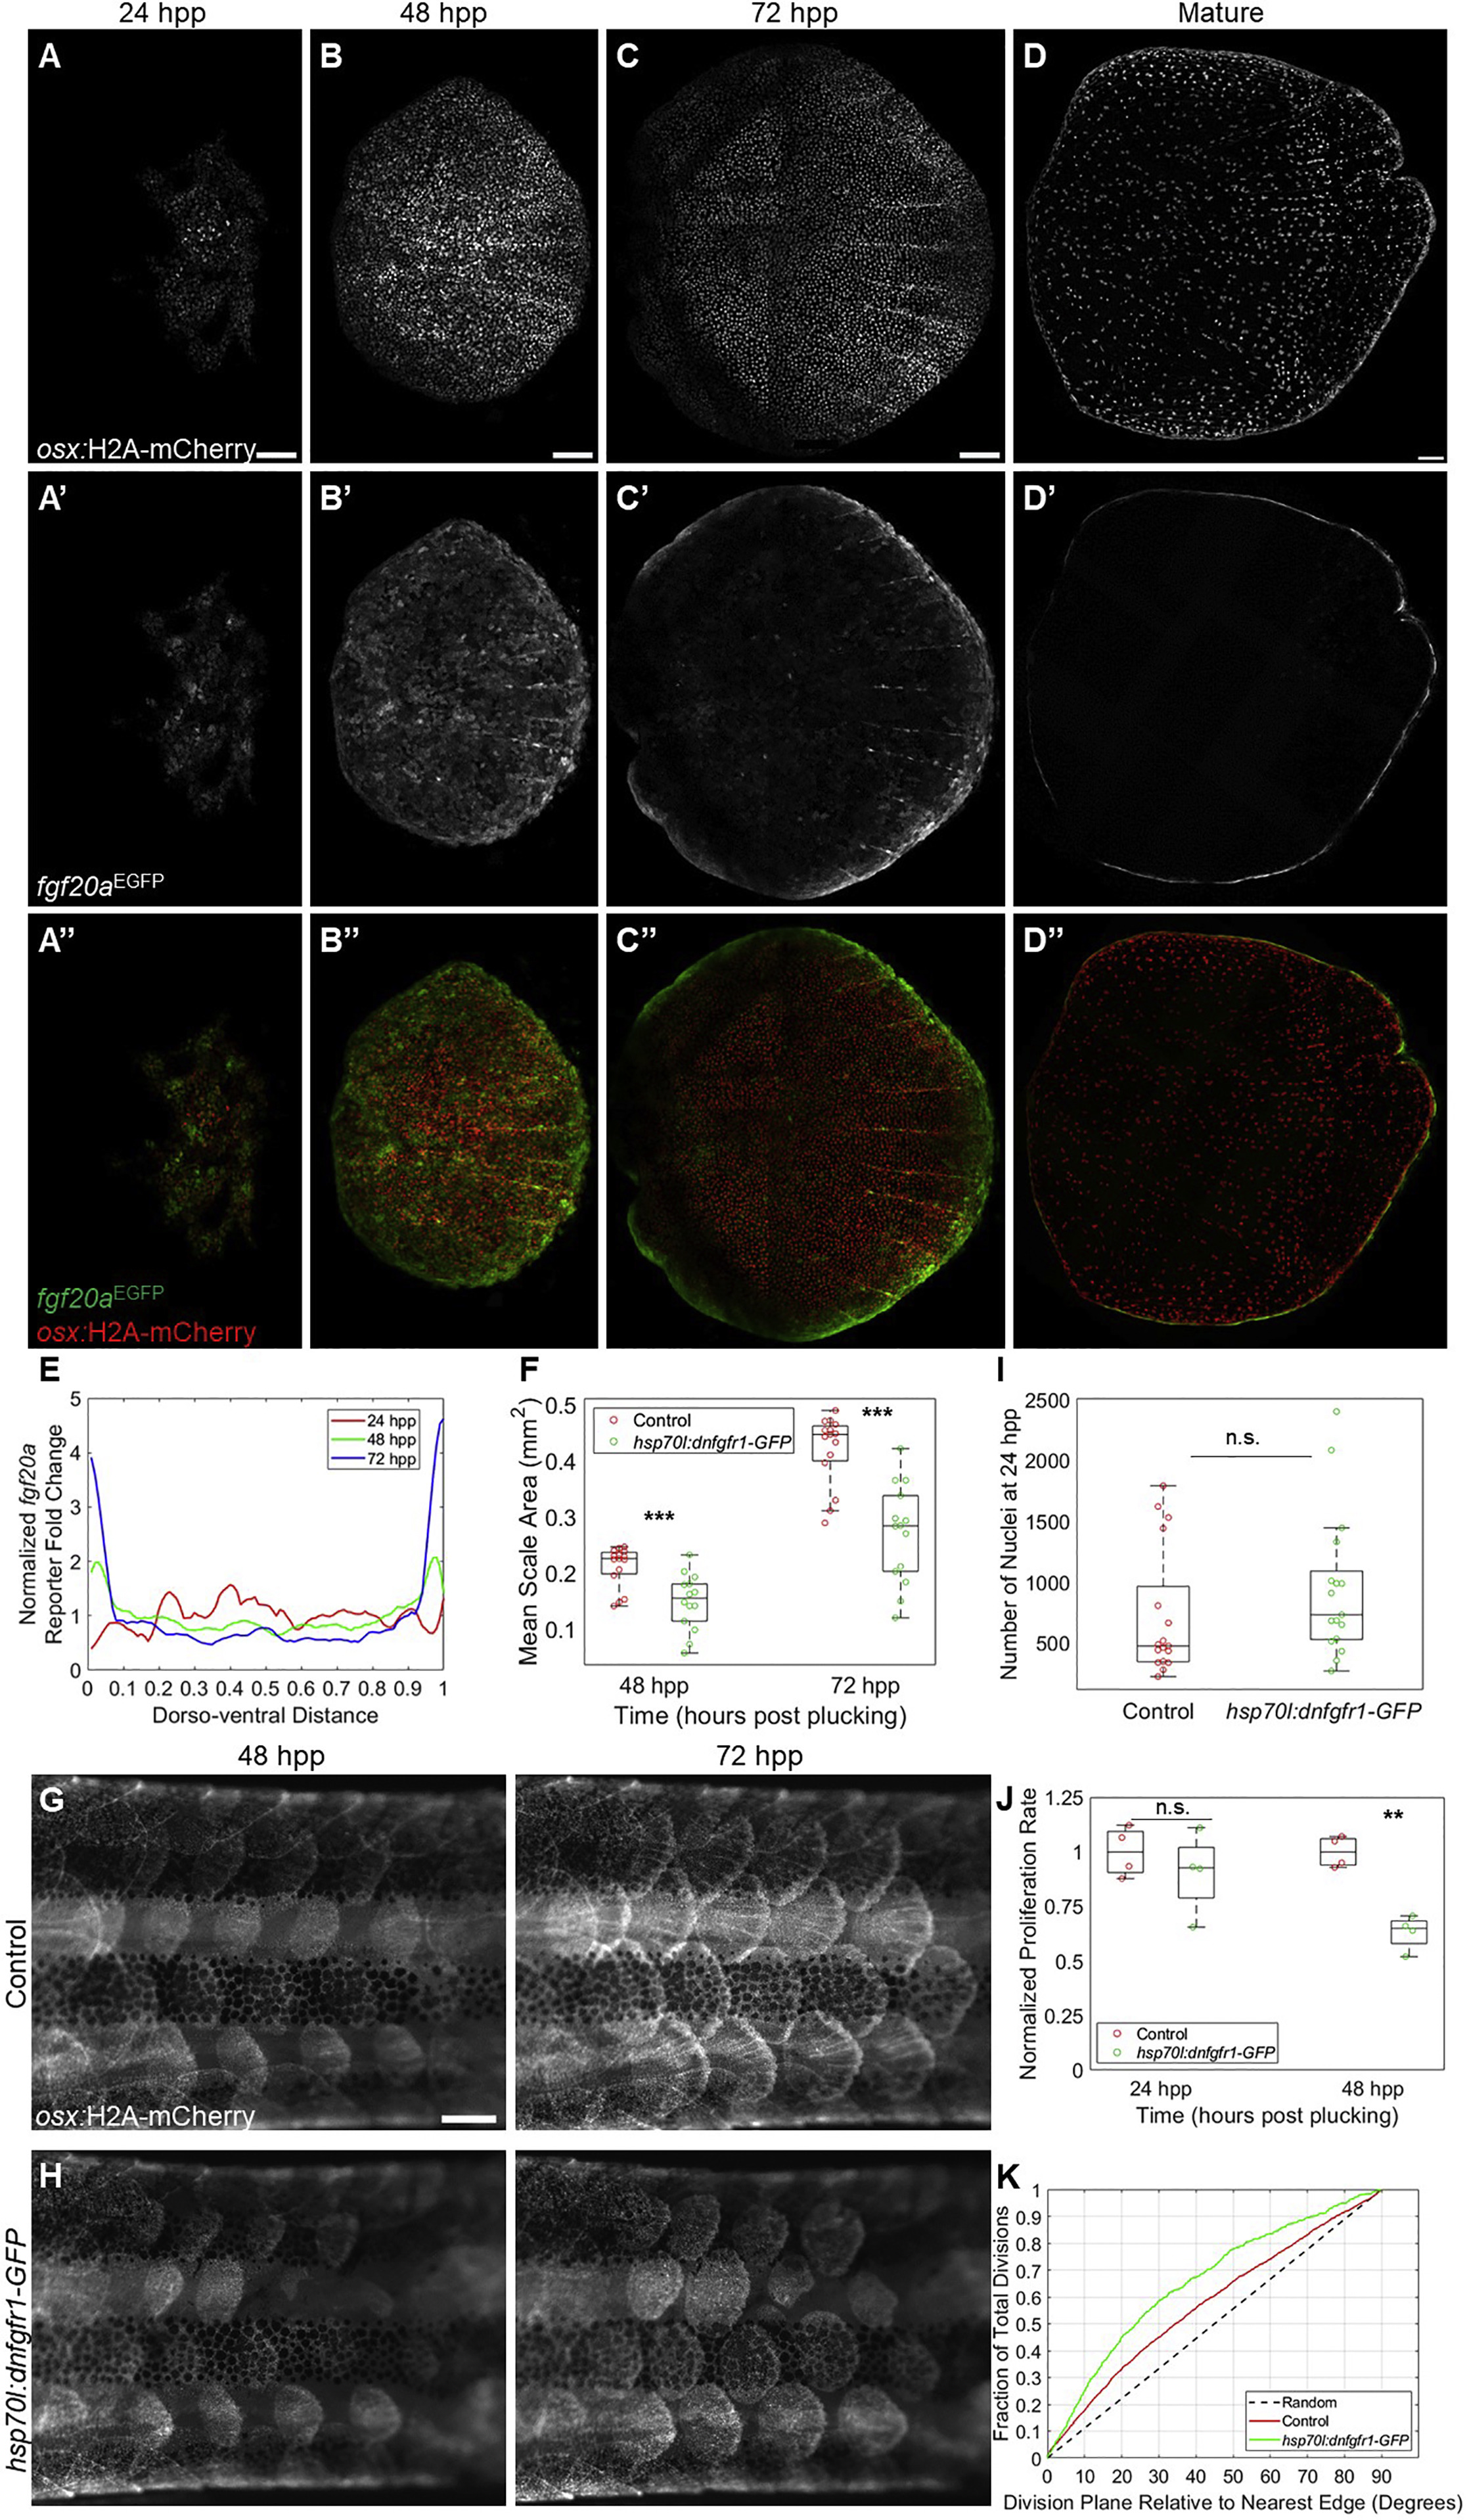
Fig. 4 Fibroblast Growth Factor Signaling Modulates Scale Regeneration (A–C’’) osx:H2A-mCherry; fgf20aEGFP regenerating scales at 24 (A and A’’), 48 (B and B’’), and 72 (C and C’’) hpp. fgf20a enhancer trap fluorescence (middle row) is initially distributed evenly but later localizes to the scale periphery. Scale bars represent 100 μm. (D and D’’) Mature adult osx:H2A-mCherry; fgf20aEGFP zebrafish scale with fluorescence restricted to the scale periphery. Scale bar represents 100 μm. Multiple images were stiched together in (C)–(D’’). (E) Quantification of fold change relative to mean EGFP expression in regenerating scales from 24 to 72 hpp. (F) Box and whisker plot of average scale area for wild-type (red circles) and hsp70l:dnfgfr1-GFP (green circles) fish at 48 and 72 hpp. hsp70l:dnfgfr1-GFP fish had smaller scales at both time points (n = 15 control, 14 hsp70l:dnfgfr1-GFP fish). ∗∗∗p < 0.001. (G and H) Regenerating scales at 48 (left column) and 72 (right column) hpp in heat-shocked osx:H2A-mCherry; hsp70l:dnfgfr1-GFP fish (H) and osx:H2A-mCherry siblings lacking the heat shock transgene (G). Scale bar represents 500 μm. (I) Box and whisker plot comparing number of nuclei counted in individual control and hsp70l:dnfgfr1-GFP fish at 24 hpp. No significant difference was detected (n = 17 control scales, 17 hsp70l:dnfgfr1-GFP scales). (J) Box and whisker plot showing proliferation rate of control and hsp70l:dnfgfr1-GFP scales imaged in the 24 hpp+ range and 48 hpp+ range, normalized to the mean proliferation rate of time-matched controls. Proliferation is significantly reduced in hsp70l:dnfgfr1-GFP fish at 48 hpp+ (n = 4 control and 4 hsp70l:dnfgfr1-GFP scales, 2 each imaged from 48 to 58 hpp and 53 to 63 hpp) but at 24 hpp+ (n = 4 control and 4 hsp70l:dnfgfr1-GFP fish, 2 each imaged from 24 to 34 hpp and 27 to 37 hpp). ∗∗p < 0.01. (K) Cumulative distribution function of division plane relative to nearest scale edge for control and hsp70l:dnfgfr1-GFP scales imaged from 48 hpp onward. hsp70l:dnfgfr1-GFP fish show a greater bias toward dividing in line with the plane of the nearest edge.