
|
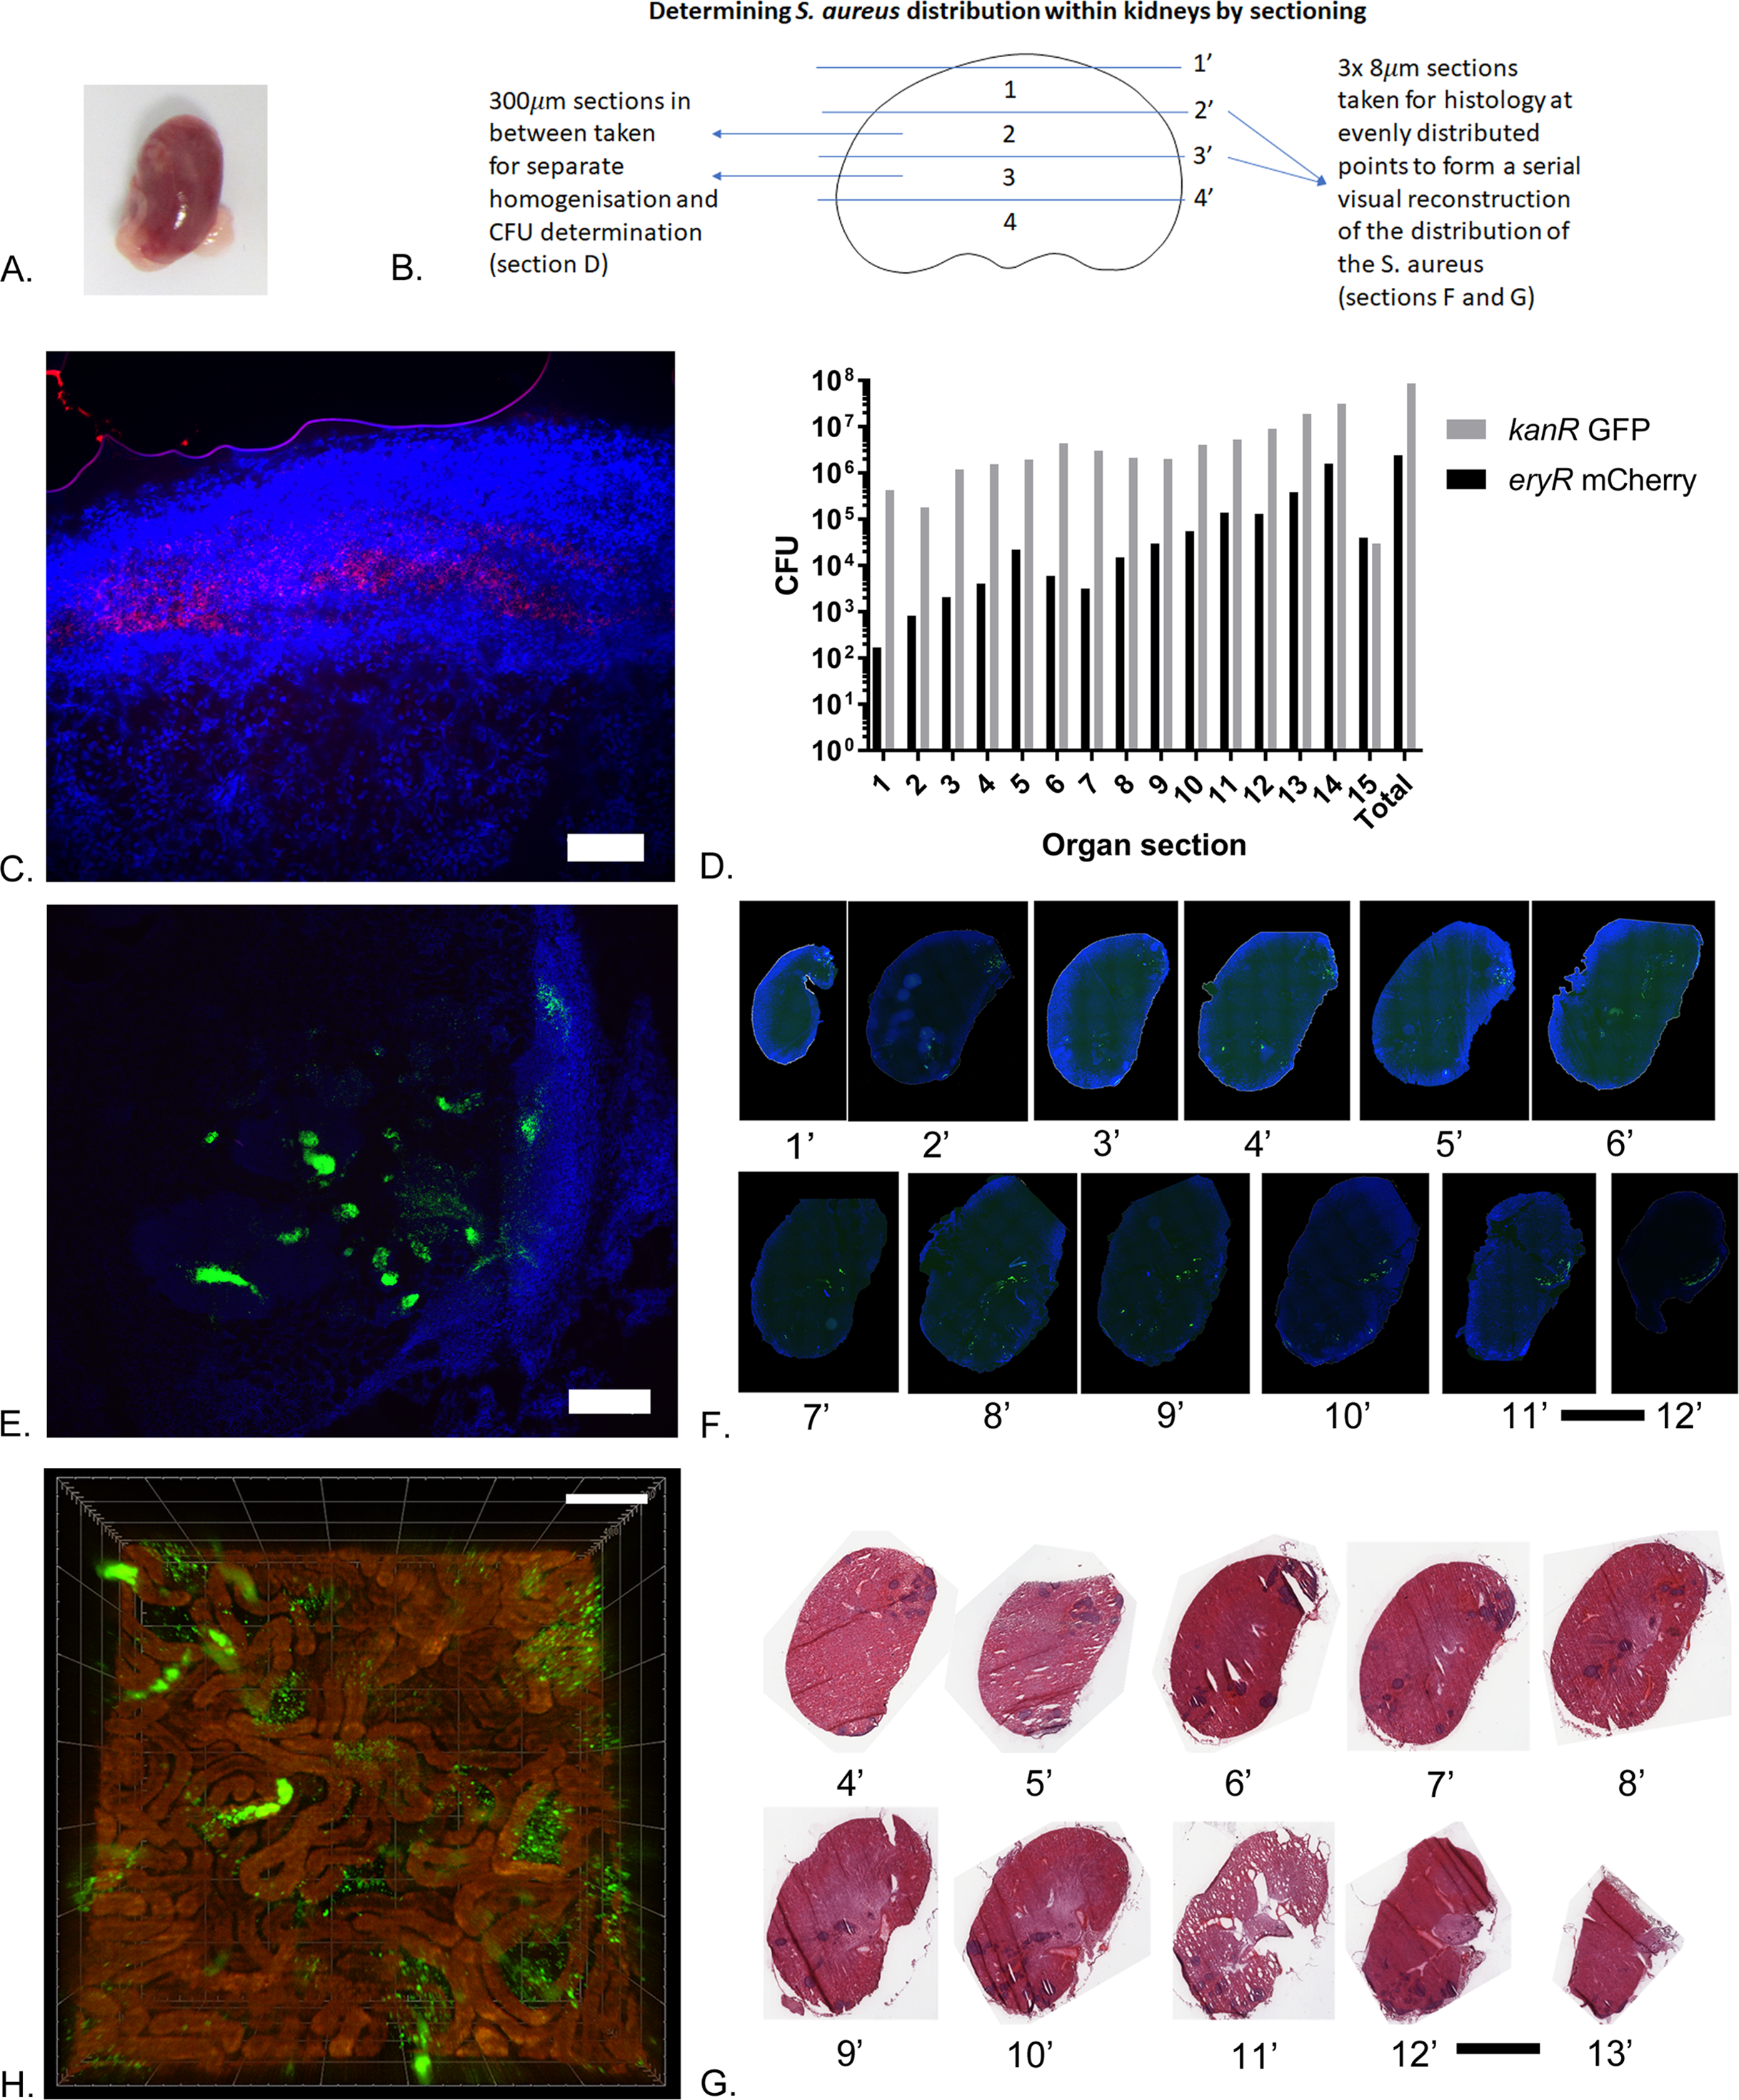
Fig. 5 The dynamics of Staphylococcus aureus abscesses within a kidney organ. (A) The left kidney after dissection and before sectioning showing the multilobed abscesses throughout the kidney. (B) Schematic showing how a kidney was sectioned in order to determine the distribution of S. aureus throughout the organ both through histology (Sections F and G) and CFU determination (Section D). (C) Representative image of an S. aureus mCherry abscess. Scale bar: 100μm (D) CFU derived from homogenised sections show that the S. aureus is spatially segregated within infected organs and is unevenly distributed. (E) Representative image of S. aureus GFP abscesses. mCherry and GFP S. aureus are very infrequently found together. Scale bar: 200μm. (F) Fluorescent images showing the GFP tagged S. aureus in histology sections corresponding to the CFU sections. Scale bar: 3mm. (G) The corresponding H and E stained sections showing the abscesses. Scale bar: 3mm. (H) Summary lightsheet microscopy image of a cleared kidney abscess caused by S. aureus GFP. Scale bar: 100μm. show less