
|
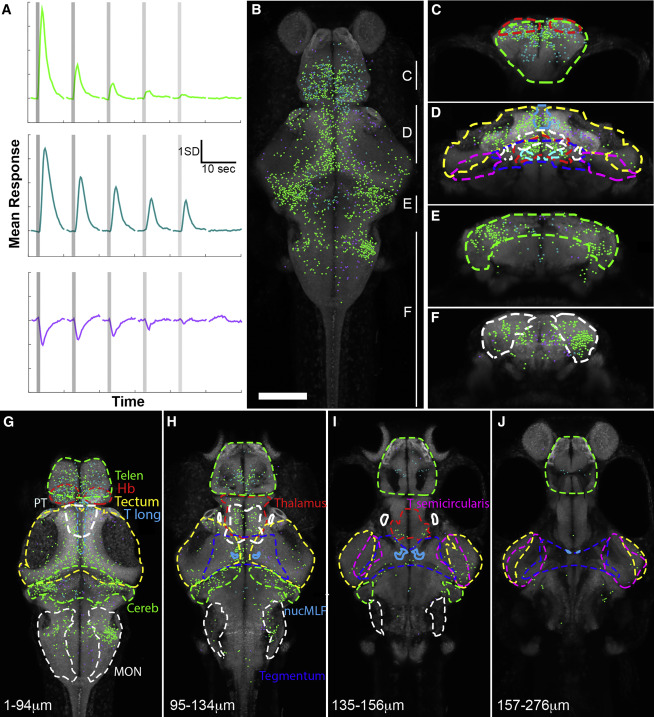
Fig. 2 Vestibular Responses across the Larval Zebrafish Brain
(A) Functional clustering of 4,611 vestibular-responsive ROIs revealed three distinct response profiles. This panel shows the mean response across each cluster of neurons to fictive vestibular stimuli at various OT powers (indicated in Figure 1), applied to the lateral edge of the right utricular otolith. Vertical lines show the times of stimulation, and three trials at each power are averaged to produce this graph.
(B) A maximum intensity projection of all ROIs’ locations in a combined reference brain (a rotation of this stack is shown in Video S4). ROIs’ colors correspond to their cluster, as shown in (A), and are maintained throughout this paper.
(C–F) Coronal virtual stacks at different rostro-caudal positions of the map (rostro-caudal ranges are indicated in B), with responsive brain regions delineated.
(G–J) Virtual horizontal stacks at different dorso-ventral positions (indicated distances below the dorsal surface of the brain) with the same regions delineated. Regional outlines are color coded and labeled as follows: Telen, telencephalon; Hb, habenulae; PT, pretectum; T Long, torus longitudinalis; Cereb, cerebellum; MON, medial octavolateralis nucleus; nucMLF, nucleus of the medial longitudinal fascicle; T semicircularis, torus semicircularis.
Scale bar in (B) indicates 100 μm. (B) and (G)–(J) are rostral up (as for all dorsal images in the paper), and (C)–(F) are dorsal up (as for all coronal images in the paper). This figure shows the combined results across 13 whole larval brains in response to outward trapping of the right otolith, and the same applies to Figures 3, 4, and 5. See also Figures S1, S2, S3, and S4, Videos S3 and S4, and Table S2.