
Fig. 3
- ID
- ZDB-IMAGE-190322-8
- Publication
- Shu et al., 2018 - Depletion of Tissue-Specific Ion Transporters Causes Differential Expression of PRL Targets in Response to Increased Levels of Endogenous PRL
- All Figures
- Figures for Shu et al., 2018
|
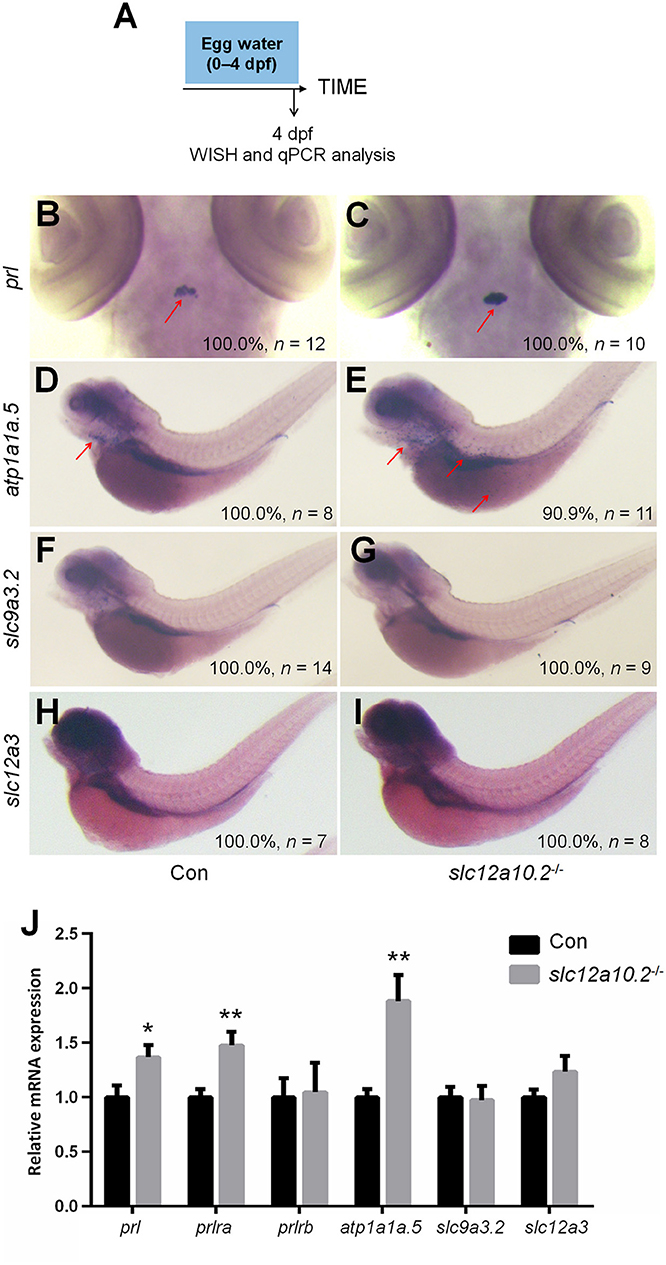
Fig. 3 Expressions of prl and PRL targets in control and slc12a10.2-deficient larvae at 4 dpf. (A) Schematic diagram of the rearing timeline. Larvae were harvested at 4 dpf for WISH and qPCR analysis. (B,C) WISH analysis using the probe of prl in control and slc12a10.2-deficient larvae at 4 dpf. (D,E) WISH analysis using the probe of atp1a1a.5 in control and slc12a10.2-deficient larvae at 4 dpf. (F,G) WISH analysis using the probe of slc9a3.2 in control and slc12a10.2-deficient larvae at 4 dpf. (H,I) WISH analysis using the probe of slc12a3 in control and slc12a10.2-deficient larvae at 4 dpf. Red arrows indicate the expressions of the nominated genes. (J) Expression levels of prl, prlra, prlrb, atp1a1a.5, slc9a3.2, and slc12a3 in control larvae and slc12a10.2-deficient larvae at 4 dpf were examined with qPCR. *P < 0.05. **P < 0.01.