
Fig. 7
- ID
- ZDB-IMAGE-190201-26
- Publication
- Shaw et al., 2018 - Stable transgenic C9orf72 zebrafish model key aspects of the ALS/FTD phenotype and reveal novel pathological features
- All Figures
- Figures for Shaw et al., 2018
|
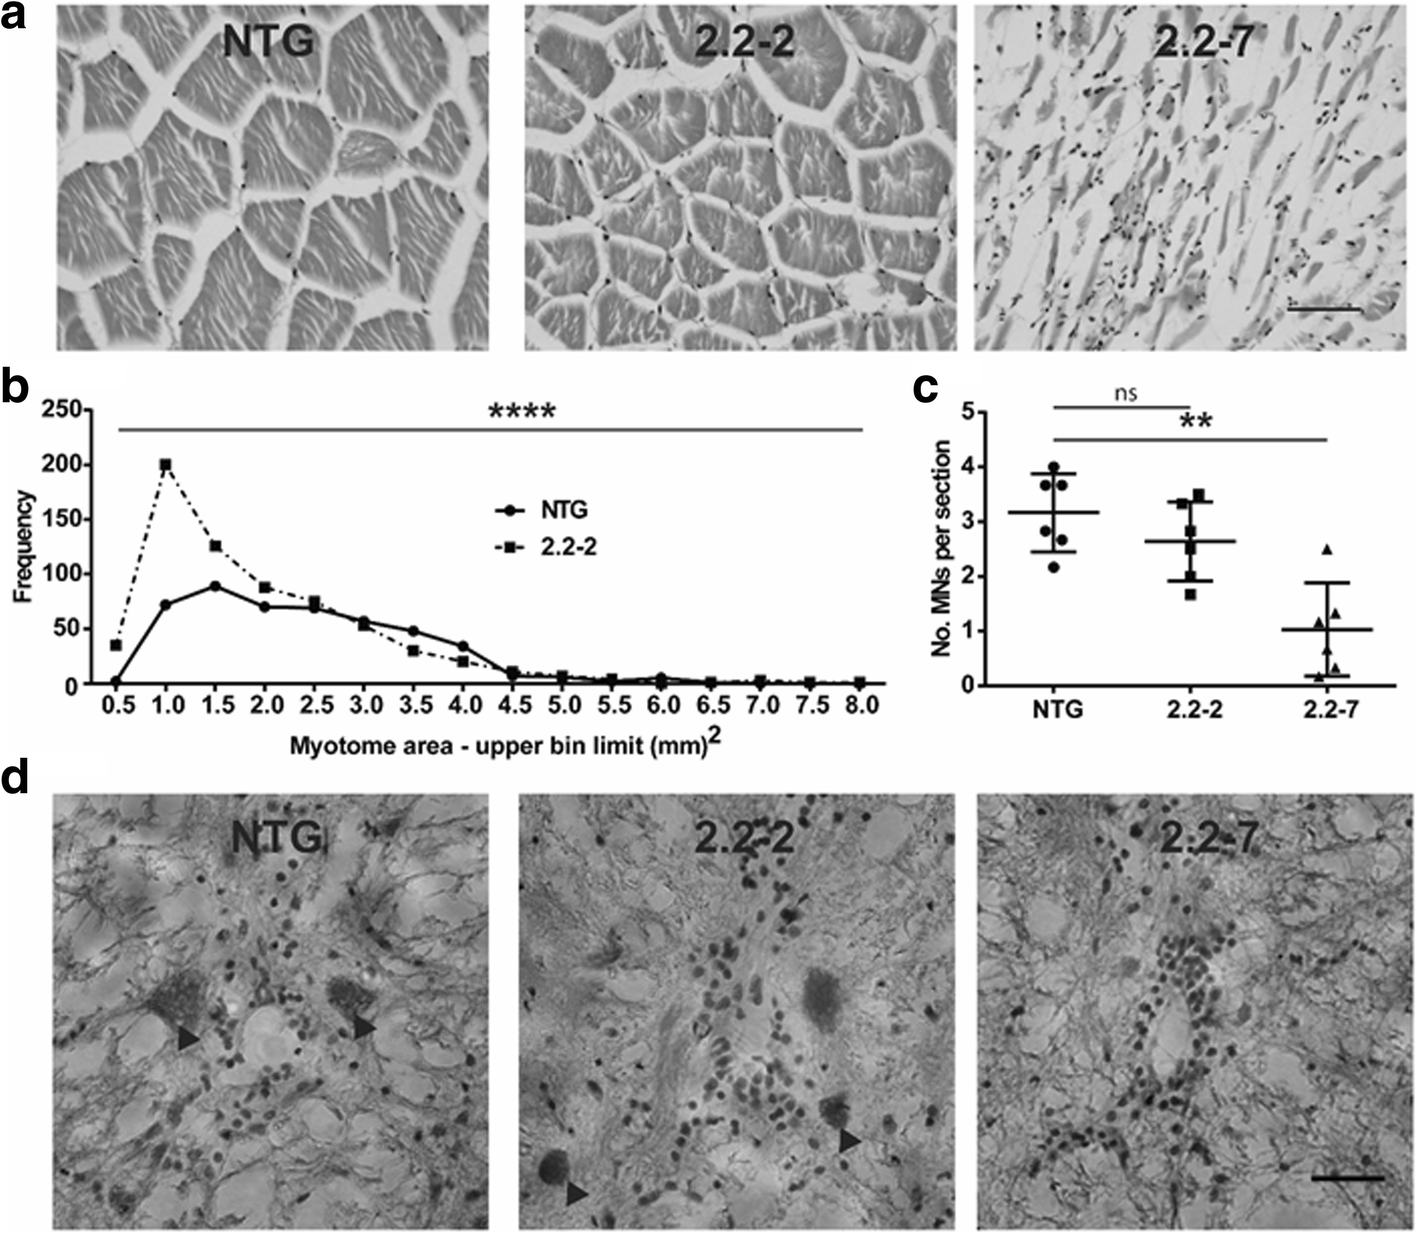
Fig. 7
C9orf72 model zebrafish display muscle atrophy and motor neuron loss. (a) Representative H&E staining of zebrafish epaxial muscle (body muscle) myotomes. Scale bar = 50 μm. (b) Frequency distribution of 2.2–2 and NTG myotome sizes. N = 6 individual zebrafish per genotype. (c) Motor neuron counts show that 2.2–7 zebrafish have significant motor neuron loss compared to NTG. N = 6 individual fish per genotype. (d) Representative H&E staining of zebrafish spinal cord sections, motor neurons are denoted by arrowheads. Scale bar = 25 μm. Myotome size data are shown as the frequency of myotome sizes binned into defined ranges, motor neuron count data are mean +/− standard deviation; *P < 0.05, **P < 0.01, ***P < 0.001 and ****P < 0.0001