
Fig. 4
- ID
- ZDB-IMAGE-190201-21
- Antibodies
- Publication
- Lu et al., 2018 - Inducible Intestine-Specific Expression of krasV12 Triggers Intestinal Tumorigenesis In Transgenic Zebrafish.
- All Figures
- Figures for Lu et al., 2018
|
Fig. 4
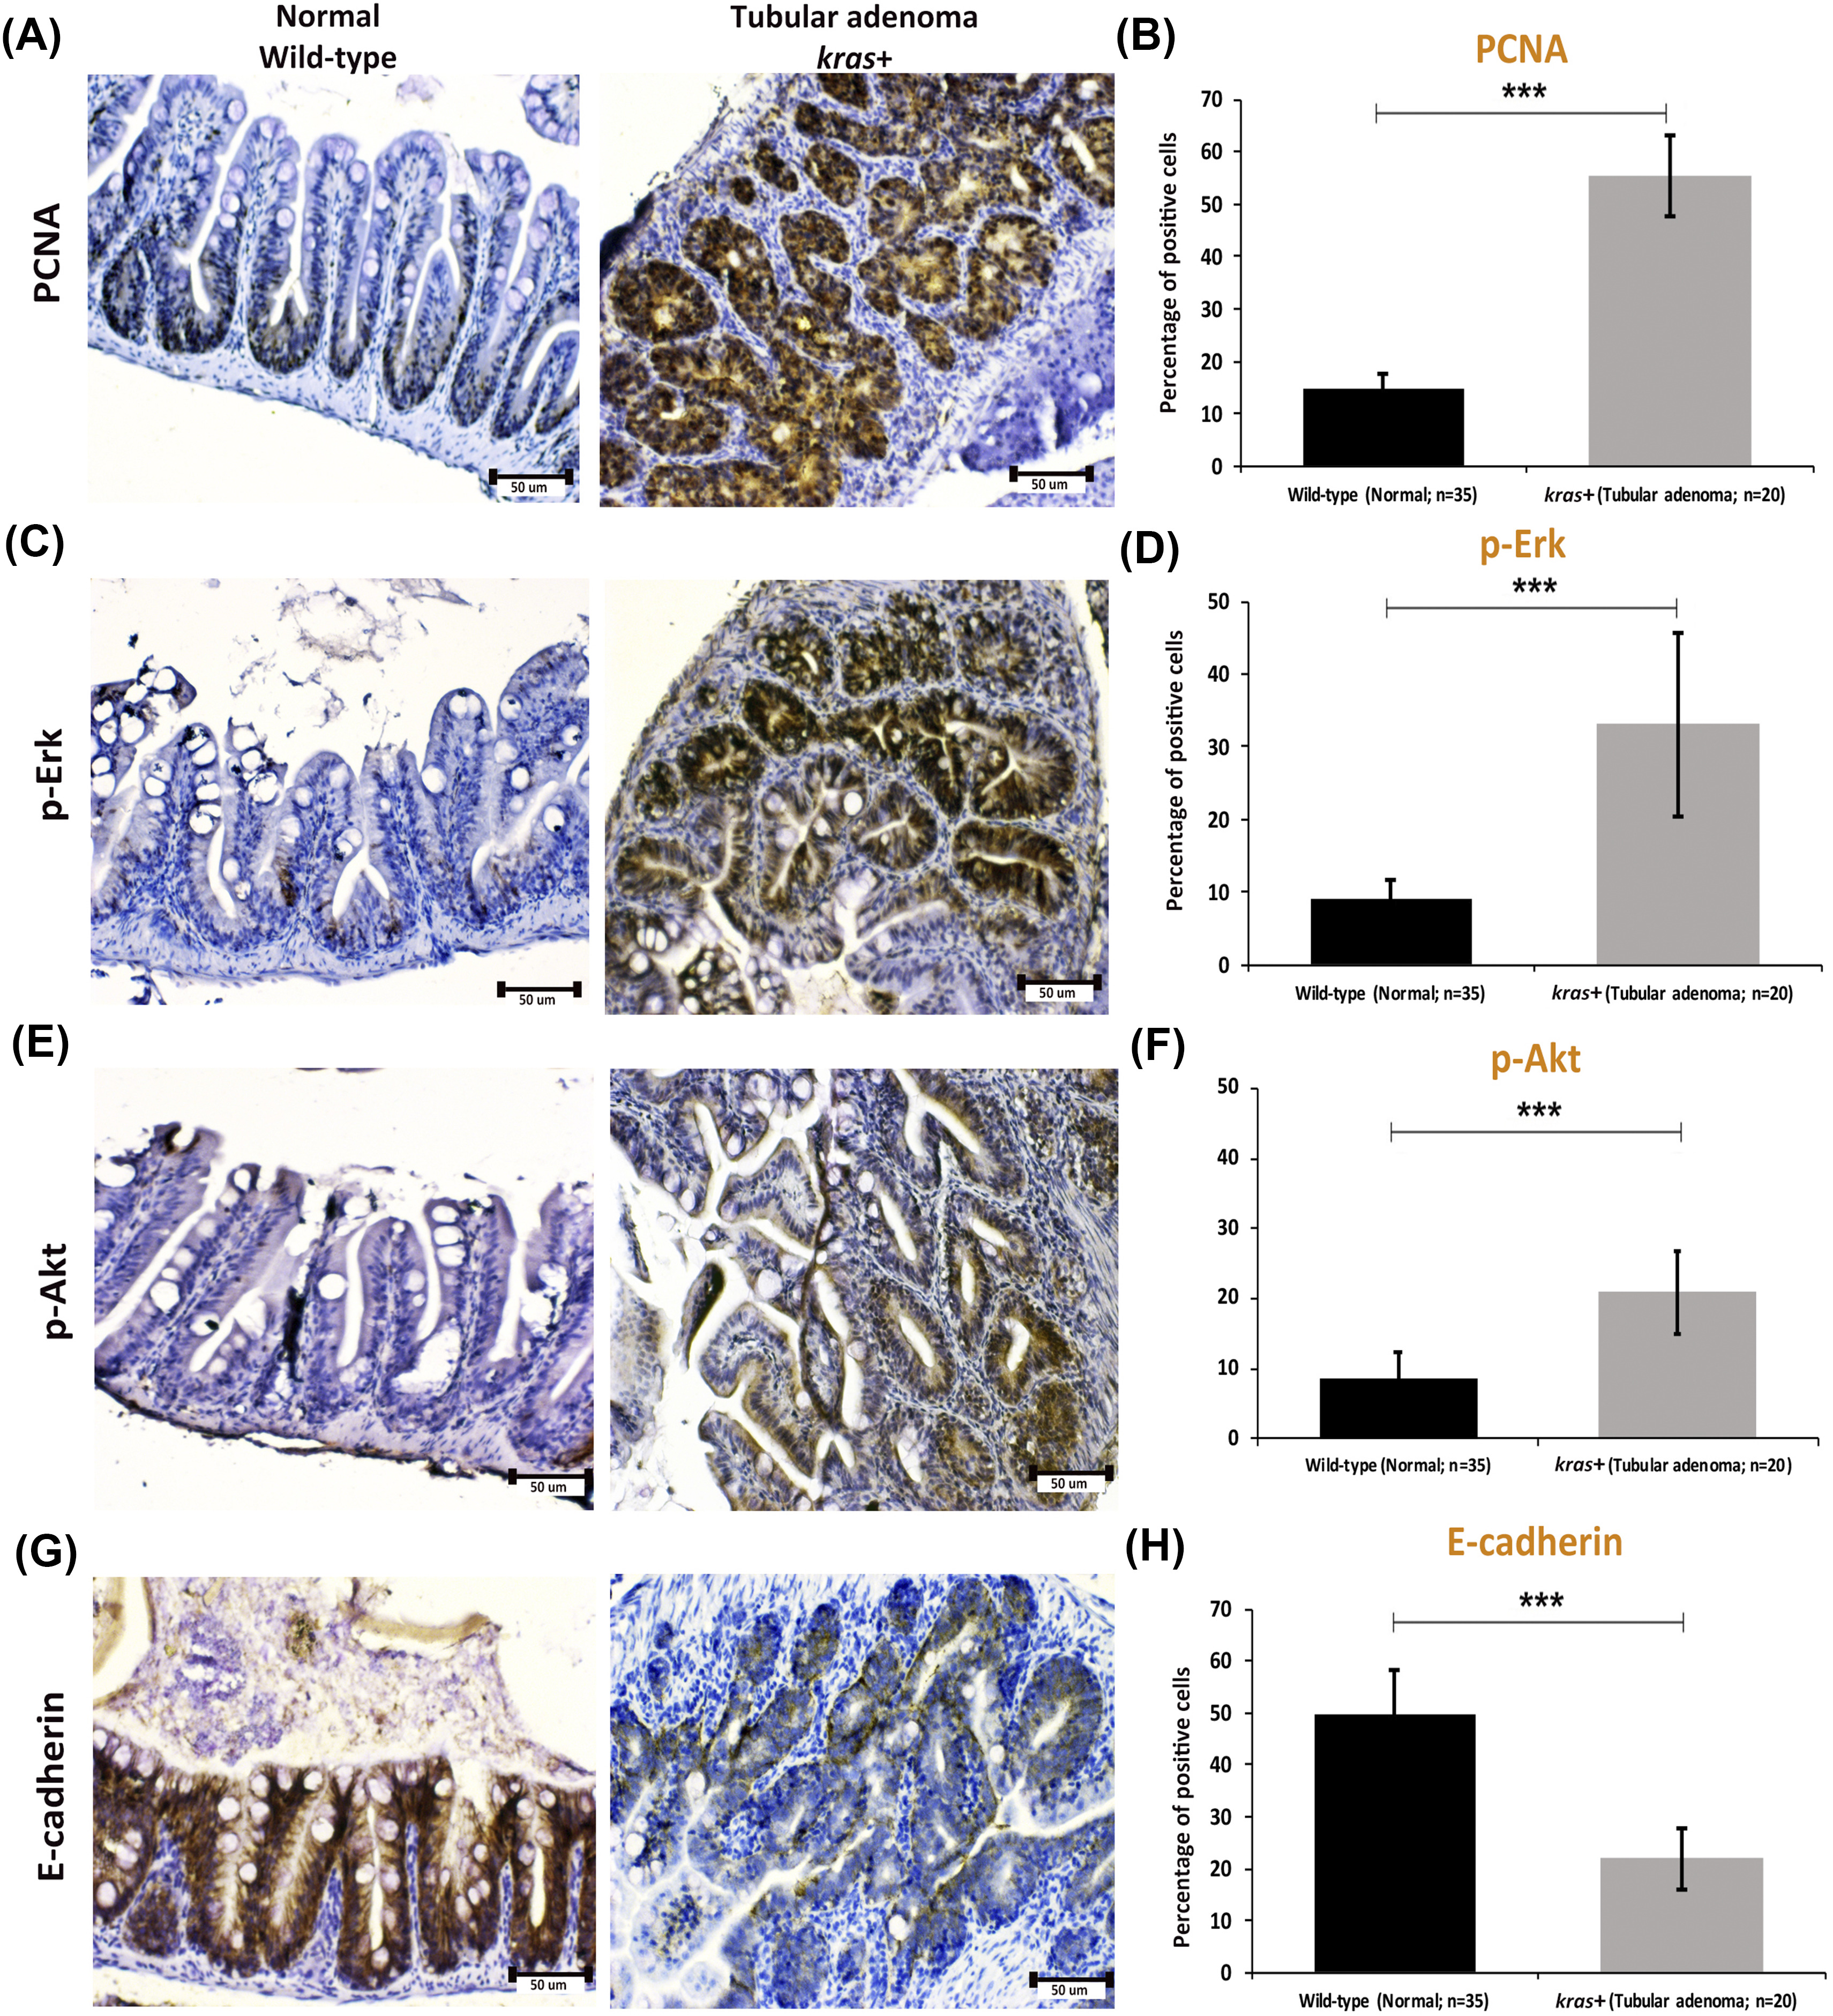
Immunocytochemical staining of PCNA, p-ErK, p-Akt, and E-cadherin in sections of normal intestine from wild-type fish and tubular adenoma from kras+ transgenic zebrafish. (A and B) Immunostaining of PCNA (A) and quantification of percentages of positive cells (B). (C and D) Immunostaining of p-Erk (C) and quantification of percentages of positive cells (D). (E and F) Immunostaining of p-Art (E) and quantification of percentages of positive cells (F). (G and H) Immunostaining of E-cadherin (G) and quantification of percentages of positive cells (H). Numbers of samples from each group are indicated in the quantification histograms. Statistical significance: ***P < .001.