
Fig. 3
- ID
- ZDB-IMAGE-190131-4
- Publication
- Gordon et al., 2018 - Hedgehog signaling regulates cell motility and optic fissure and stalk formation during vertebrate eye morphogenesis
- All Figures
- Figures for Gordon et al., 2018
|
Fig. 3
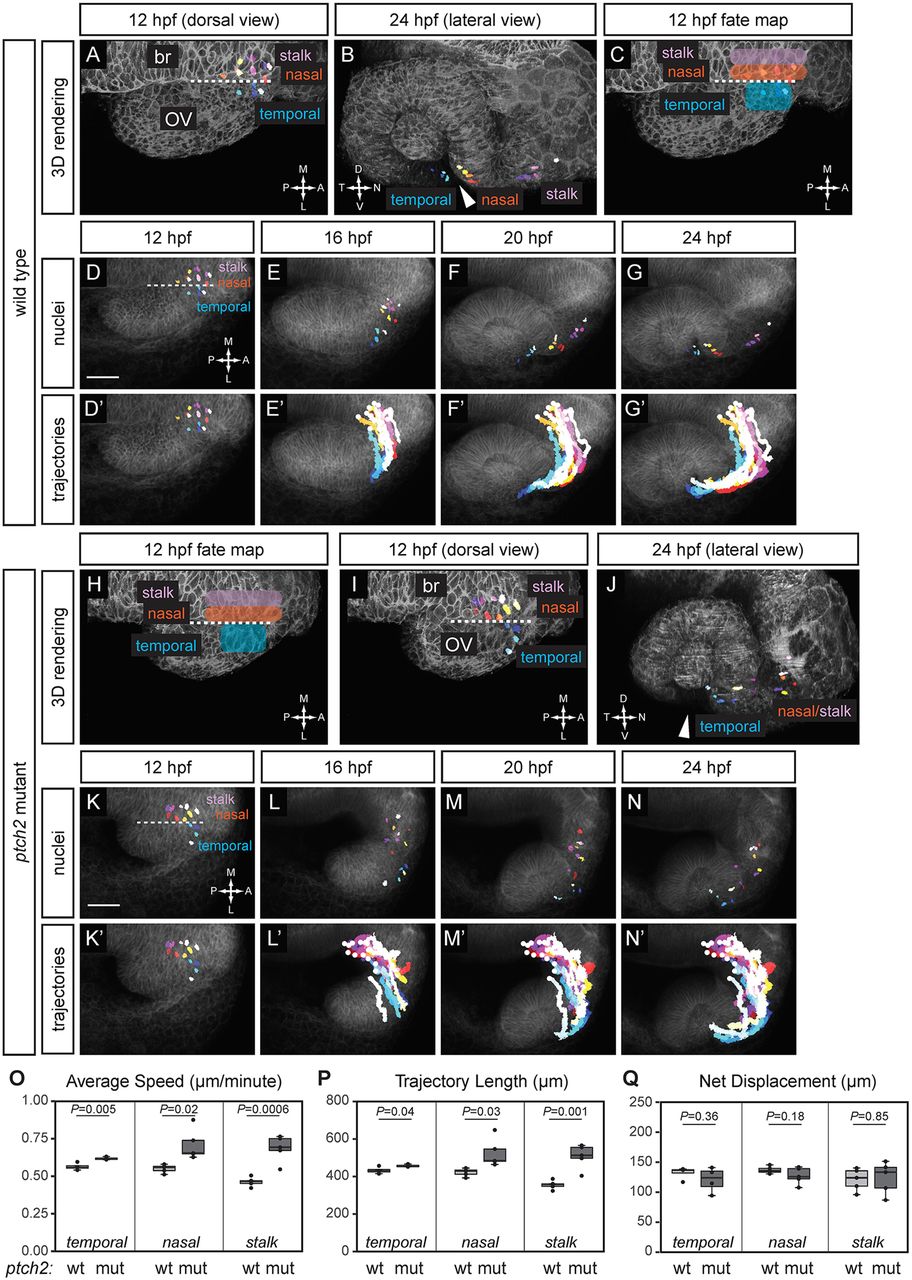
Origins and trajectories of cells contributing to the optic fissure are disrupted in the ptch2tc294z mutant. (A-G′) Wild-type optic fissure and stalk cell movements (12-24 hpf). (A,B) Rendering of nuclei and membrane channel, at 12 hpf, dorsal view (A) and 24 hpf, lateral view (B). (C) Fate map of optic fissure and stalk cells. (D-G) Nuclei over membrane channel average projection. (D′-G′) Trajectories over membrane channel average projection. (H-N′) ptch2tc294z mutant optic fissure cell movements (12-24 hpf). (H) Application of wild-type fate map to ptch2tc294z mutant optic vesicle. (I,J) Rendering of selected nuclei and membrane channel, at 12 hpf, dorsal view (I) and 24 hpf, lateral view (J). Arrowheads in B and J indicate the optic fissure opening. (K-N) Nuclei over membrane channel average projection. (K′-N′) Trajectories over membrane channel average projection. (O-Q) Quantification of cell-tracking data in wild-type (wt) and ptch2tc294z mutant (mut) embryos. n=4 temporal cells, 5 nasal cells, and 5 stalk cells per genotype. (O) Three-dimensional average speed. (P) Three-dimensional trajectory length. (Q) Three-dimensional net displacement. White circles indicate trajectory origins. Blue shades, temporal nuclei; red/yellow shades, nasal nuclei; purple shades, stalk nuclei. Dashed line indicates the boundary between the optic vesicle and the midline region. br, brain; OV, optic vesicle. Scale bars: 50 µm.