
Fig. 8
- ID
- ZDB-IMAGE-190131-19
- Publication
- Gibb et al., 2018 - Hey2 regulates the size of the cardiac progenitor pool during vertebrate heart development
- All Figures
- Figures for Gibb et al., 2018
|
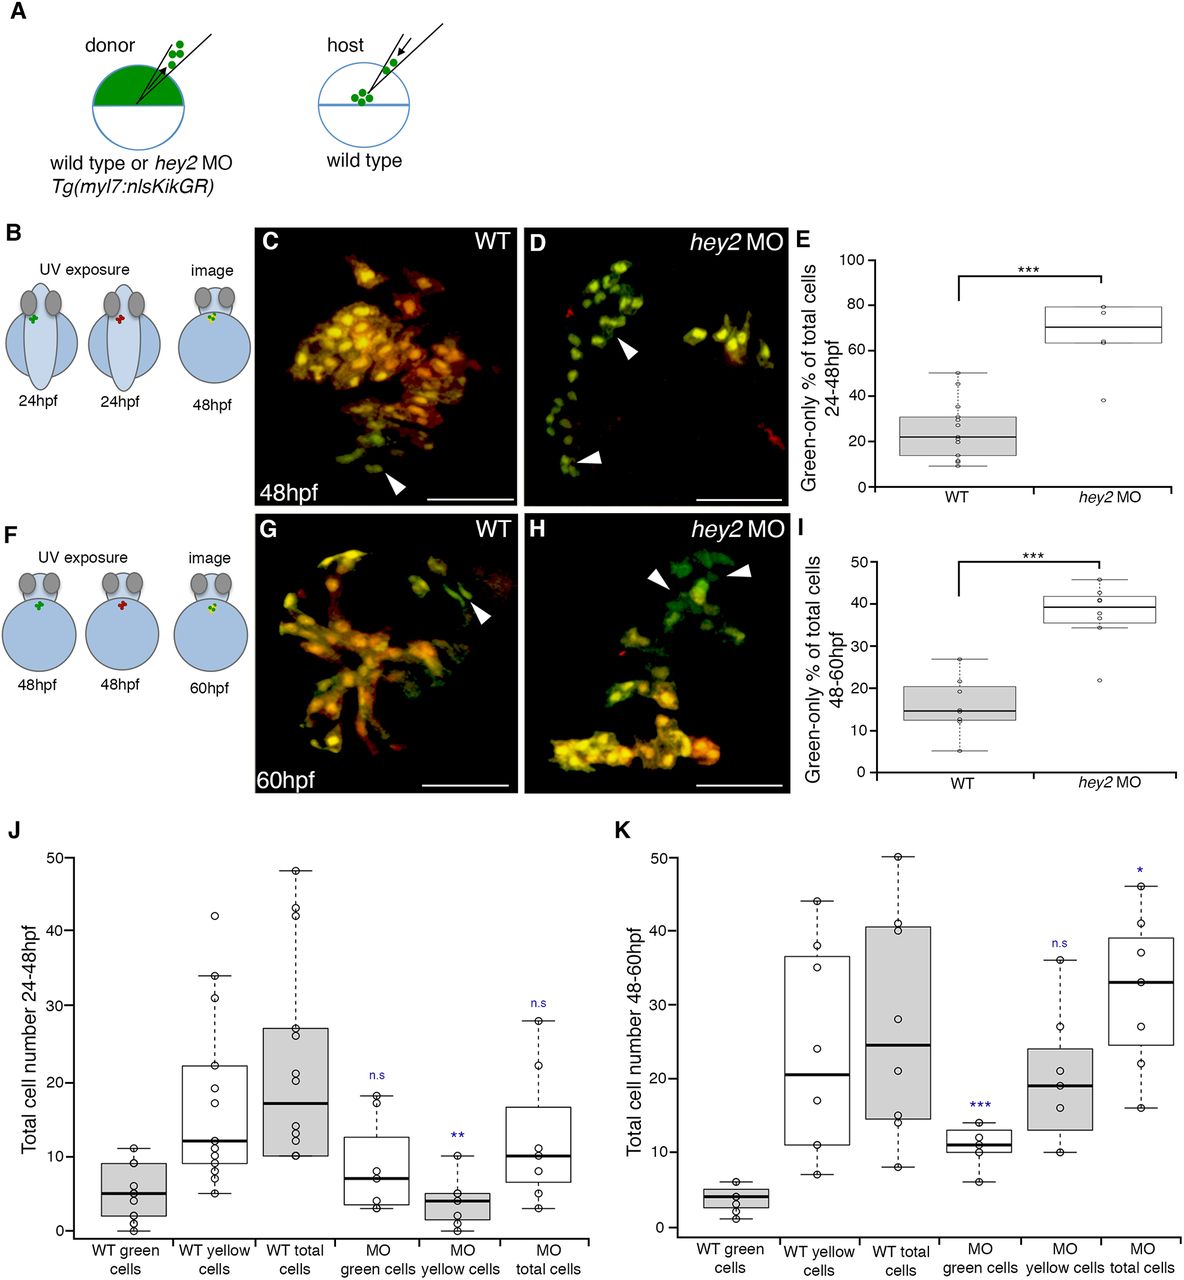
Fig. 8
Hey2 functions cell-autonomously to inhibit myocardial contribution to the heart. (A,B,F) Schematic representations of transplantation strategy. (B-D) Following transplantation of Tg(myl7:nlsKiKGR) wild-type (C) and hey2 morphant (D) donors to wild-type hosts, embryos were photoconverted at 24 hpf and imaged at 48 hpf. (E) Boxplot analysis demarking the percentage of donor transplanted CMs that are green-only in control and hey2 MO embryos (n=13, control and n=7, hey2 MO). (F-H) Transplants in which photoconversion was carried out at 48 hpf, followed by imaging at 60 hpf, using wild-type (G) and hey2 MO (H) donors. (I) Boxplot analysis demarking the percentage of green-only transplanted CMs in control and hey2 MO embryos (n=8, control and n=9, hey2 MO). (J,K) Boxplot analysis displaying total numbers of transplant-derived Tg(myl7:nlsKikGR) control and hey2 MO CMs at 24-48 hpf (J; n=12 wild-type green, n=15 wild-type yellow; n=7 hey2 MO green, n=7 hey2 MO yellow) and 48-60 hpf (K; n=8 wild-type green, n=8 wild-type yellow; n=7 hey2 MO green, n=7 hey2 MO yellow). Green cells indicate later (post-photoconversion) contribution, whereas yellow cells indicate pre-photoconversion contribution. Arrowheads indicate green-only (late addition) cardiomyocytes. Data are mean±s.e.m.; *P<0.05, **P<0.01, ***P<0.001; n.s, no significant difference. For box plots, boxes indicate the 25th to 75th percentiles of values, with each data point shown as a dot. Median is shown as a dark line inside the box, while whiskers extend 1.5 times the ineterquartile range from the 25th to 75th percentiles. Scale bars: 50 µm.