
|
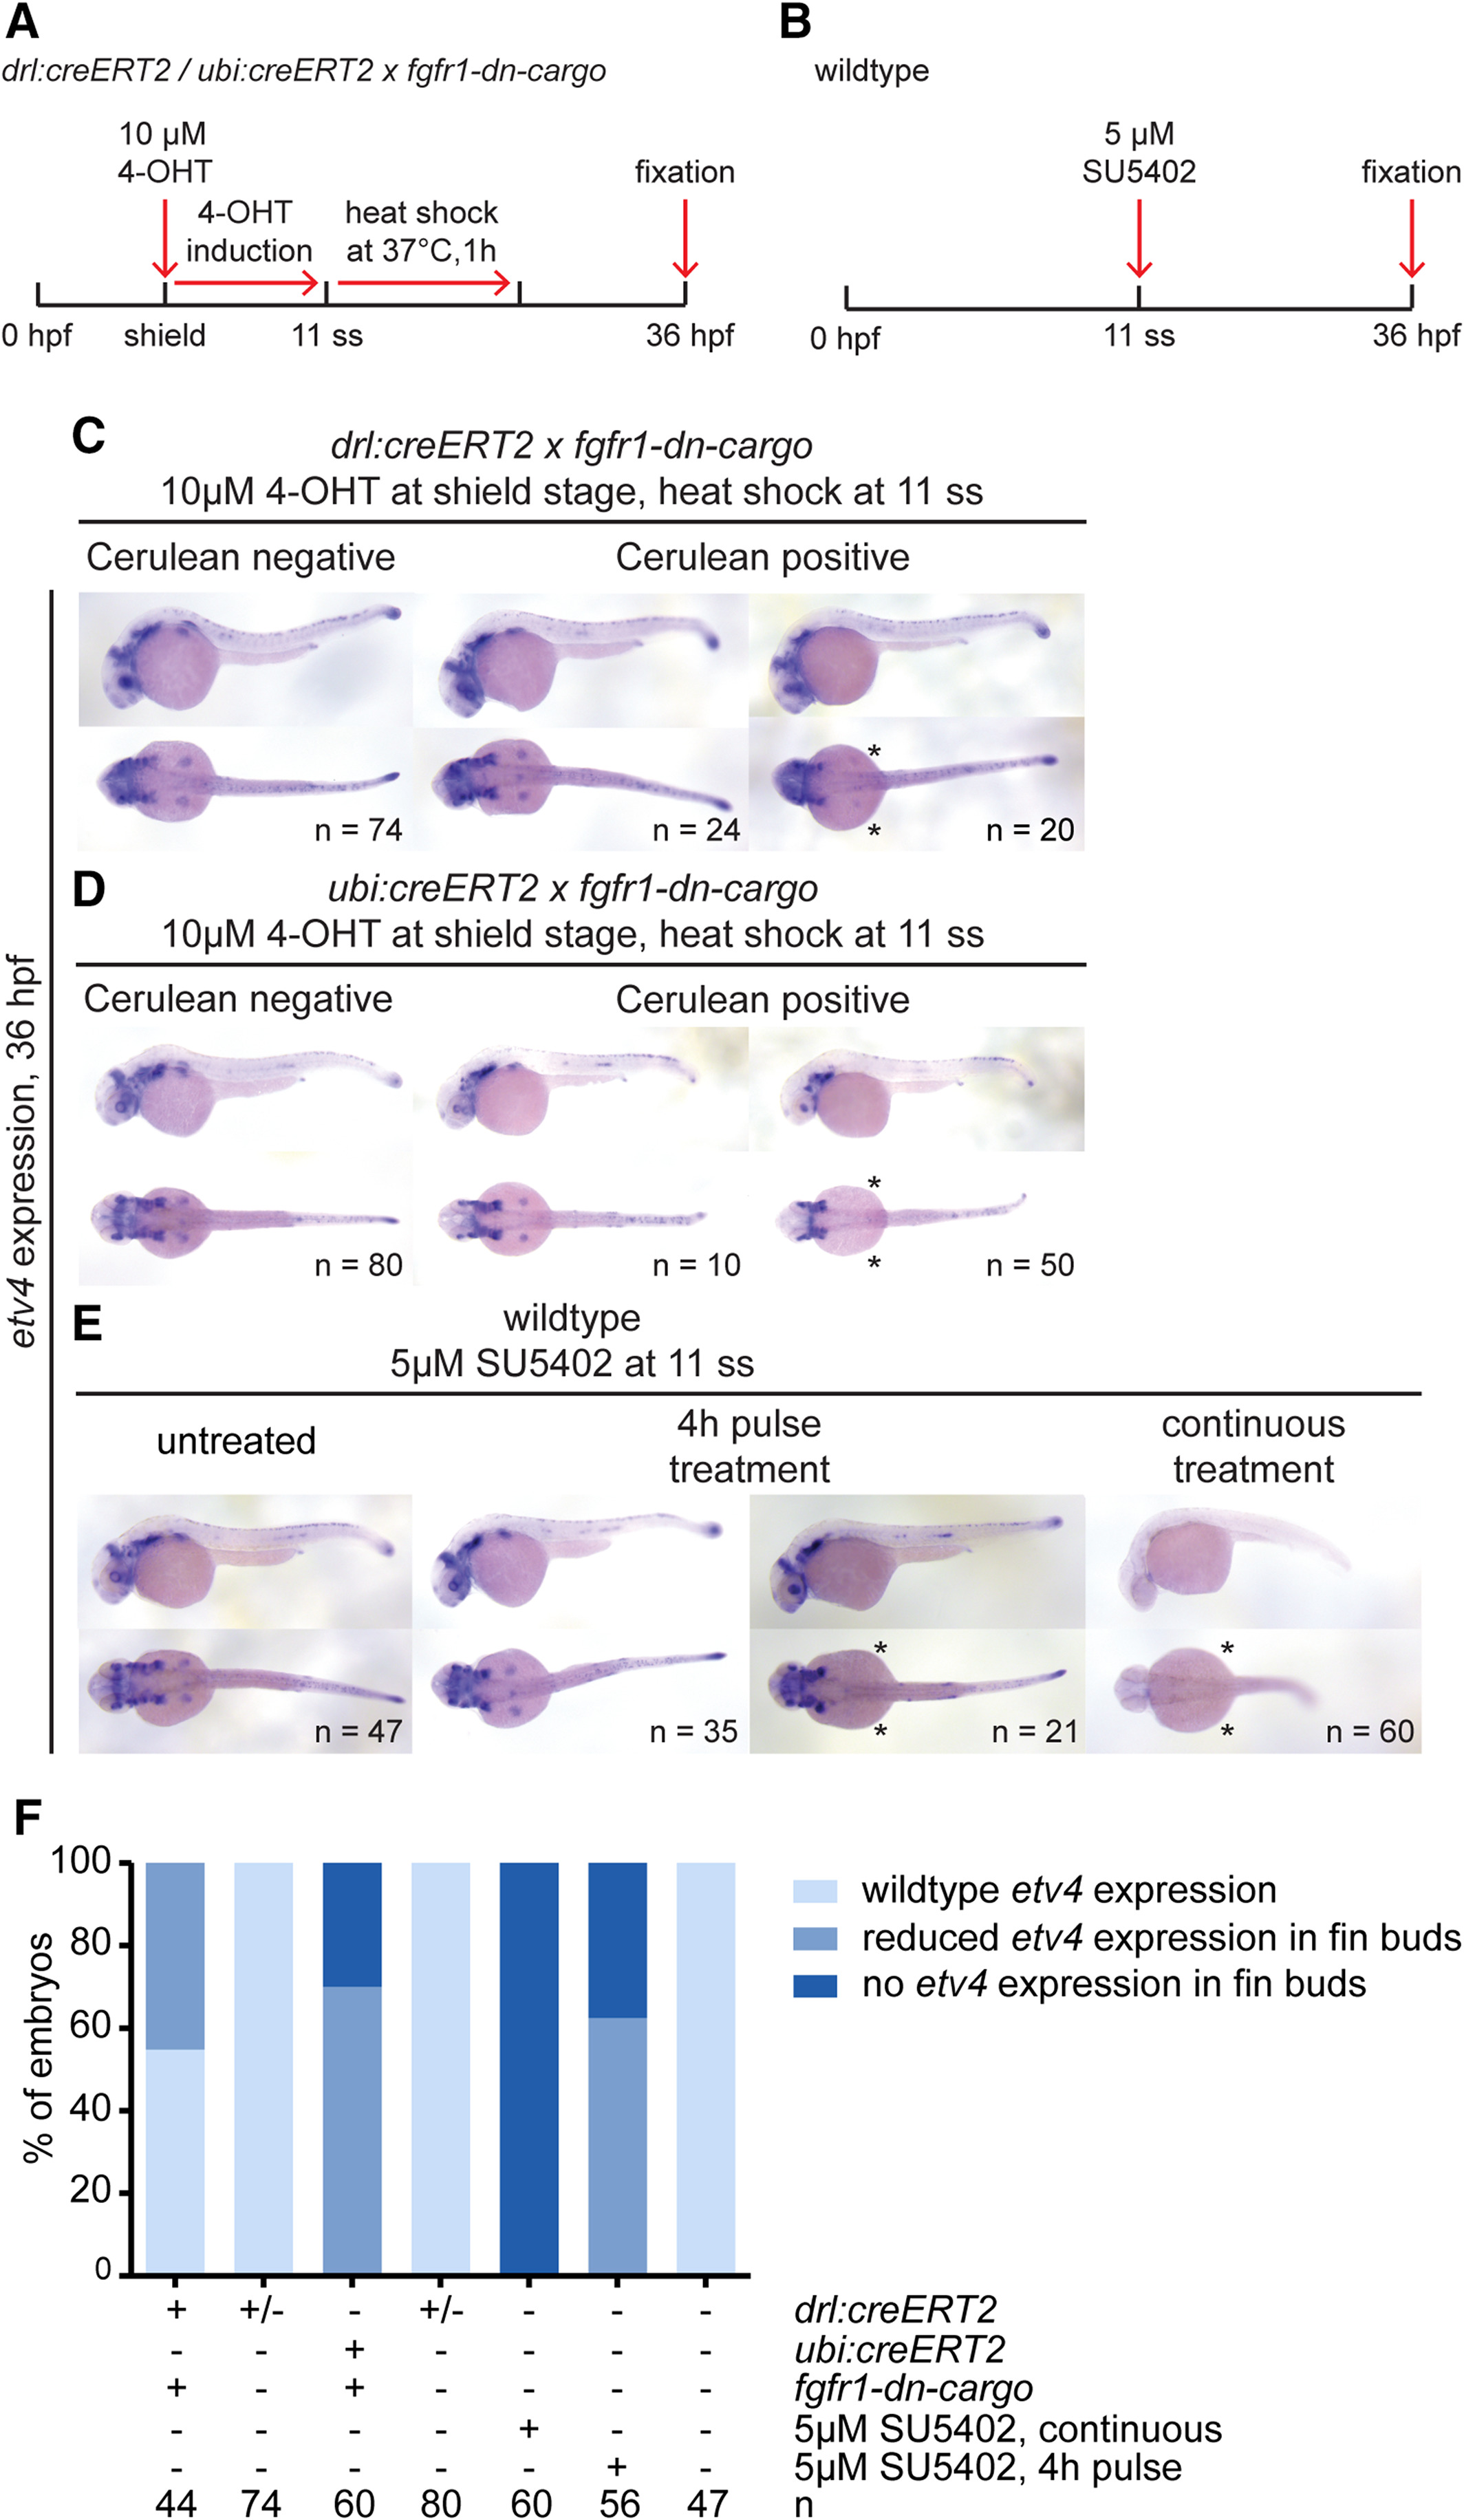
Fig. 5
etv4 expression in tissue‐specific and global FGF signaling–perturbed embryos at 36 hpf. A,B: Transgenic embryos were treated with 4‐OHT at shield stage and heatshock‐treated at 11 ss (A), while wild‐type embryos were treated with SU5402 either continuously or for a 4‐hr pulse for comparison. B: Expression of the FGF target gene etv4 assayed at 36 hpf. C–E: etv4 expression in the different conditions. etv4 expression was grossly unaffected by LPM‐specific perturbation using drl:creERT2 priming fgfr1‐dn‐cargo (C); compare Cerulean‐negative to Cerulean‐positive, fgfr1‐dn–expressing embryos, with notable exception of pectoral fin expression that was absent in a cohort of fgfr1‐dn–expressing embryos (asterisks). etv4 was also grossly unaffected after ubiquitous FGF perturbation in cohorts of ubi:creERT2;fgfr1‐dn‐cargo embryos (D) and SU5402 pulse‐treated embryos (E), while pectoral fin expression was again affected (asterisks in D,E). Continuous FGF signaling inhibition with SU5402 per indicated conditions (B) broadly inhibited etv4 expression (asterisks in E). F: Quantification of etv4 expression in embryos subjected to embryo‐wide or tissue‐specific signaling perturbations. Number “n” indicates number of individual embryos analyzed for each condition.