
Fig. 5
- ID
- ZDB-IMAGE-181130-10
- Publication
- Roussigné et al., 2018 - Left/right asymmetric collective migration of parapineal cells is mediated by focal FGF signaling activity in leading cells
- All Figures
- Figures for Roussigné et al., 2018
|
Fig. 5
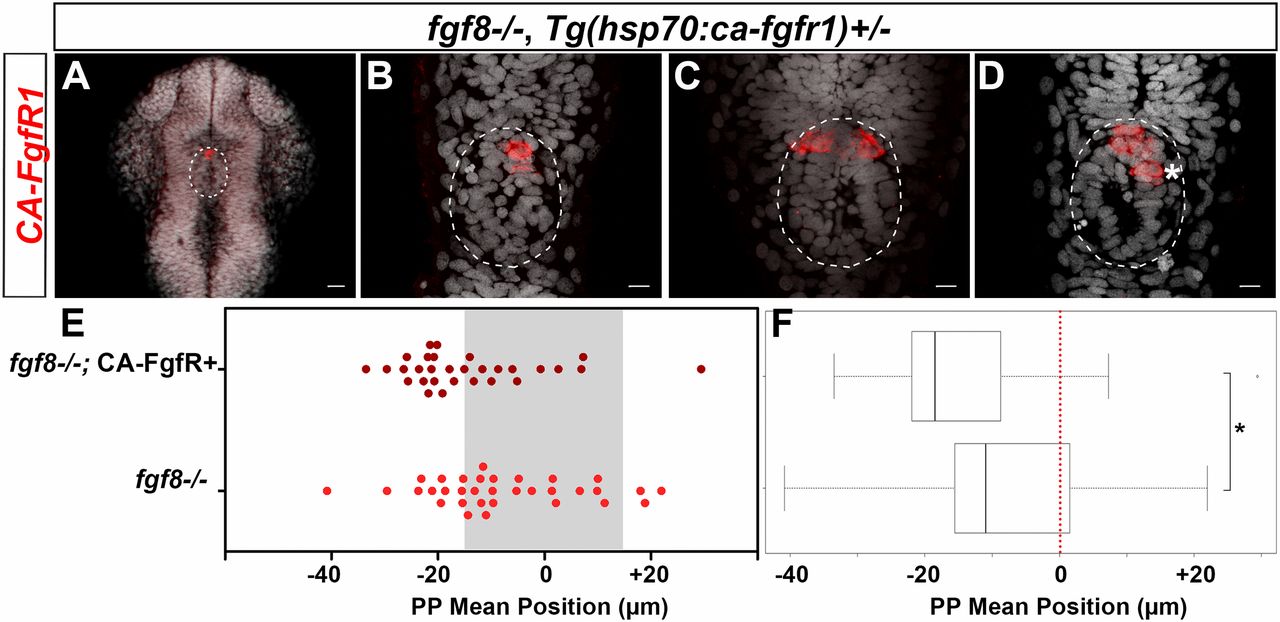
Focal activation of FGF signaling in few parapineal cells partially restores parapineal migration in fgf8−/− mutants. (A–D) Confocal 40-µm maximum projection and confocal thin 2-µm projections (B–D) showing the expression of the ca-fgfr1 transgene by in situ hybridization (red) in four different representative fgf8−/−; Tg(hsp70:ca-fgfr1)+/− embryos, 1–2 h after two cells were irradiated in the anterior epiphysis. (Scale bars, 25 µm in A and 10 µm in B–D.) Superimposed nuclear staining (Topro-3, gray) visualizes the pineal complex (white circle) consisting of both the pineal and the parapineal at this stage (26–28 hpf). ca-fgfr1 mRNA is only detected in the anterior pineal complex, in three cells (A and B) or six cells (C and D), the average number being 6 CA-FgfR1–expressing cells (n = 10 embryos). Given their location in the anterior pineal complex, most of these CA-FgfR1–expressing cells are expected to become parapineal cells; some more posterior cells (*) might become epiphyseal cells; embryo view is dorsal, anterior is up. (E) Dot plot showing, for each embryo, the mean parapineal position in micrometers distant to the brain midline (x = 0), at 52 hpf, in fgf8−/− mutants that were locally heat-shocked (two to three irridiated cells) between 25 and 29 hpf; gray-shaded zone (–15 µm and +15 µm) defines the average width of the epiphysis. Parapineal mean position in fgf8−/− mutant embryos carrying the Tg(hsp70:ca-fgfr1) transgene is slightly shifted toward the left (dark red dots, n = 30) compared with fgf8−/− mutants that do not express CA-FgfR1 (light red dots, n = 33). (F) Boxplot showing the distribution of parapineal mean position relative to the brain midline (reference 0) in same embryos. Local expression of CA-FgfR1 in few parapineal cells partially rescues parapineal migration (P = 0.02; Wilcoxon test; *indicates statistical significance in F).