
IMAGE
Fig. S3
- ID
- ZDB-IMAGE-181127-9
- Publication
- Sun et al., 2018 - Mga Modulates Bmpr1a Activity by Antagonizing Bs69 in Zebrafish
- All Figures
- Figures for Sun et al., 2018
Image
|
Figure Caption
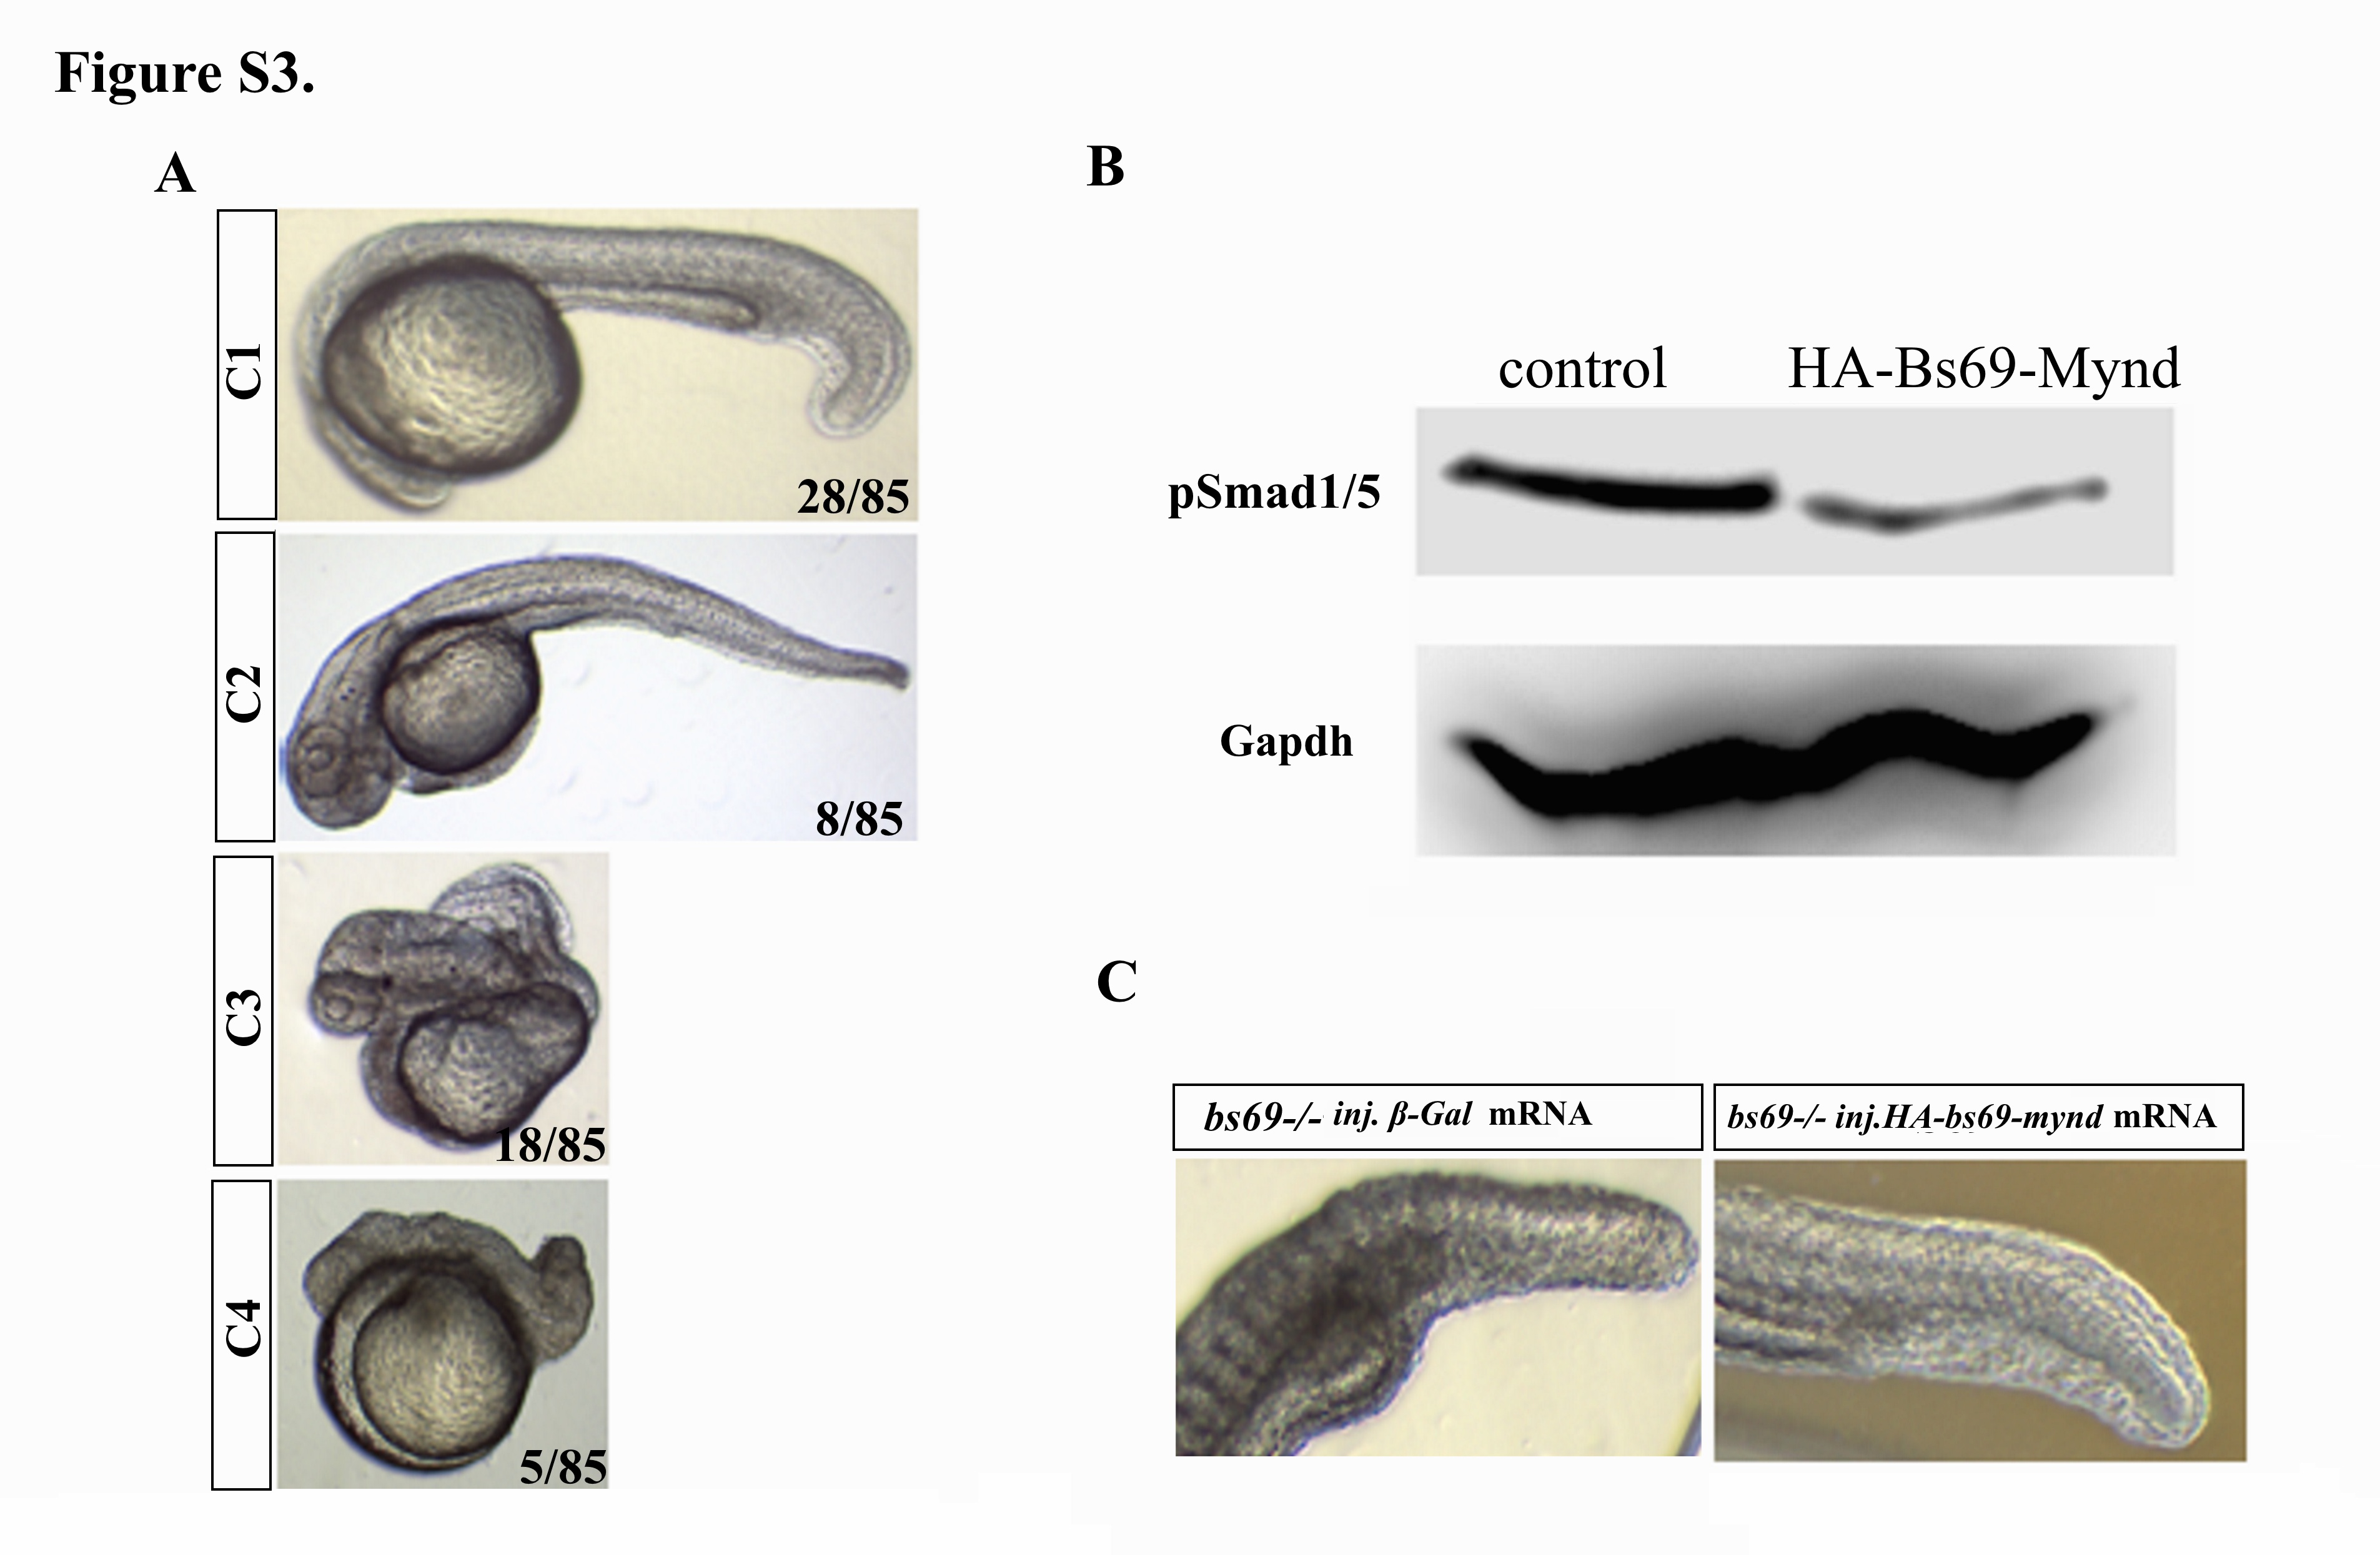
Fig. S3
(A) Dorsalized phenotypes of HA-Bs69-Mynd overexpressing embryos at 2 dpf. C1-4 classification according to DV patterning index. (B) Western blot analysis of lysates from 8 hpf HA-Bs69-Mynd overexpressing or control embryos. (C) Tail region of 2 dpf bs69 mutant embryos injected at one-cell-stage with 50 pg mRNAs encoding HA-Bs69-Mynd or β-Gal.
Acknowledgments
This image is the copyrighted work of the attributed author or publisher, and
ZFIN has permission only to display this image to its users.
Additional permissions should be obtained from the applicable author or publisher of the image.
Full text @ Front Cell Dev Biol