
|
Fig. S6
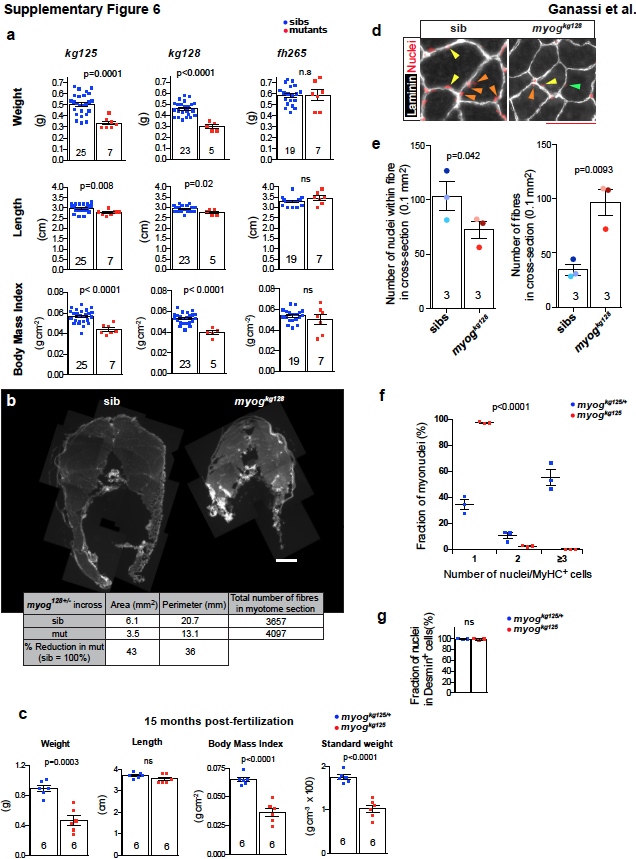
Weight and Body mass index are reduced in myog mutants.
a. Weight, length and body mass index of 120 dpf adults derived from myogkg128/+, myogkg125/+ and myogfh265/+ incrosses. Lays were reared as mixed genotypes through nursery at a density of at 50 larvae/3 L tank, decreasing to 17 fish/tank from fingerling stage. Size divergence in sibs did not correlate with genotype (+/+ or +/-), and likely reflects genetic background and feeding rate variation. b. Reconstruction of entire adult 120 dpf muscle trunk sections. Table shows total muscle area and perimeter are reduced by 43% and 36% in myogkg128 mutant adult fish compared to matched sib (sib), whereas fibre number is similar. Bar = 500 μm. c. Weight, length, body mass index and standard weight of 15 mpf (months post fertilization) adults derived from myogkg125/+ incross revealed persistent muscle growth defect in mutants. d. Representative images of transverse sections from myogkg128 mutant and sib. Laminin staining (white) and Hoechst (red) were used to highlight fibres and nuclei. Coloured arrowheads indicate nuclei within single fibres. Bar = 50 μm. e. Three fish of each genotype were cryosectioned and nuclei/fibre were scored as nuclear profiles within laminin rings. Total number of nuclei within fibres in each 0.1 mm2 section is mildly reduced, but number of fibres is increased in mutants compared to sibs. Dot colours identify individuals to allow direct comparison between the two analyses. Mean ± SEM, t-tests. ns= not significant. f. Analysis of adult-derived MPCs from 15 month old myogkg125 and sibling myogkg125/+ following 5 days of differentiation. Proportion of nuclei in MyHC+ cells showing fraction of nuclei in cells with given number of nuclei. Same data is shown as pie charts in Fig. 8d. Dots represent data from individual fish. Three fish per genotype (three technical replicate each). Mean ± SEM. g. Frequency of Desmin+ cells in mutant is comparable to sib. Three fish per genotype (three technical replicate each). Replicate numbers are given in Supplementary Table 2. Bar = 50 μm (insets = 10 μm).