
Fig. 3
- ID
- ZDB-IMAGE-181116-50
- Publication
- Walton et al., 2018 - Cyclopropane Modification of Trehalose Dimycolate Drives Granuloma Angiogenesis and Mycobacterial Growth through Vegf Signaling
- All Figures
- Figures for Walton et al., 2018
|
Fig. 3
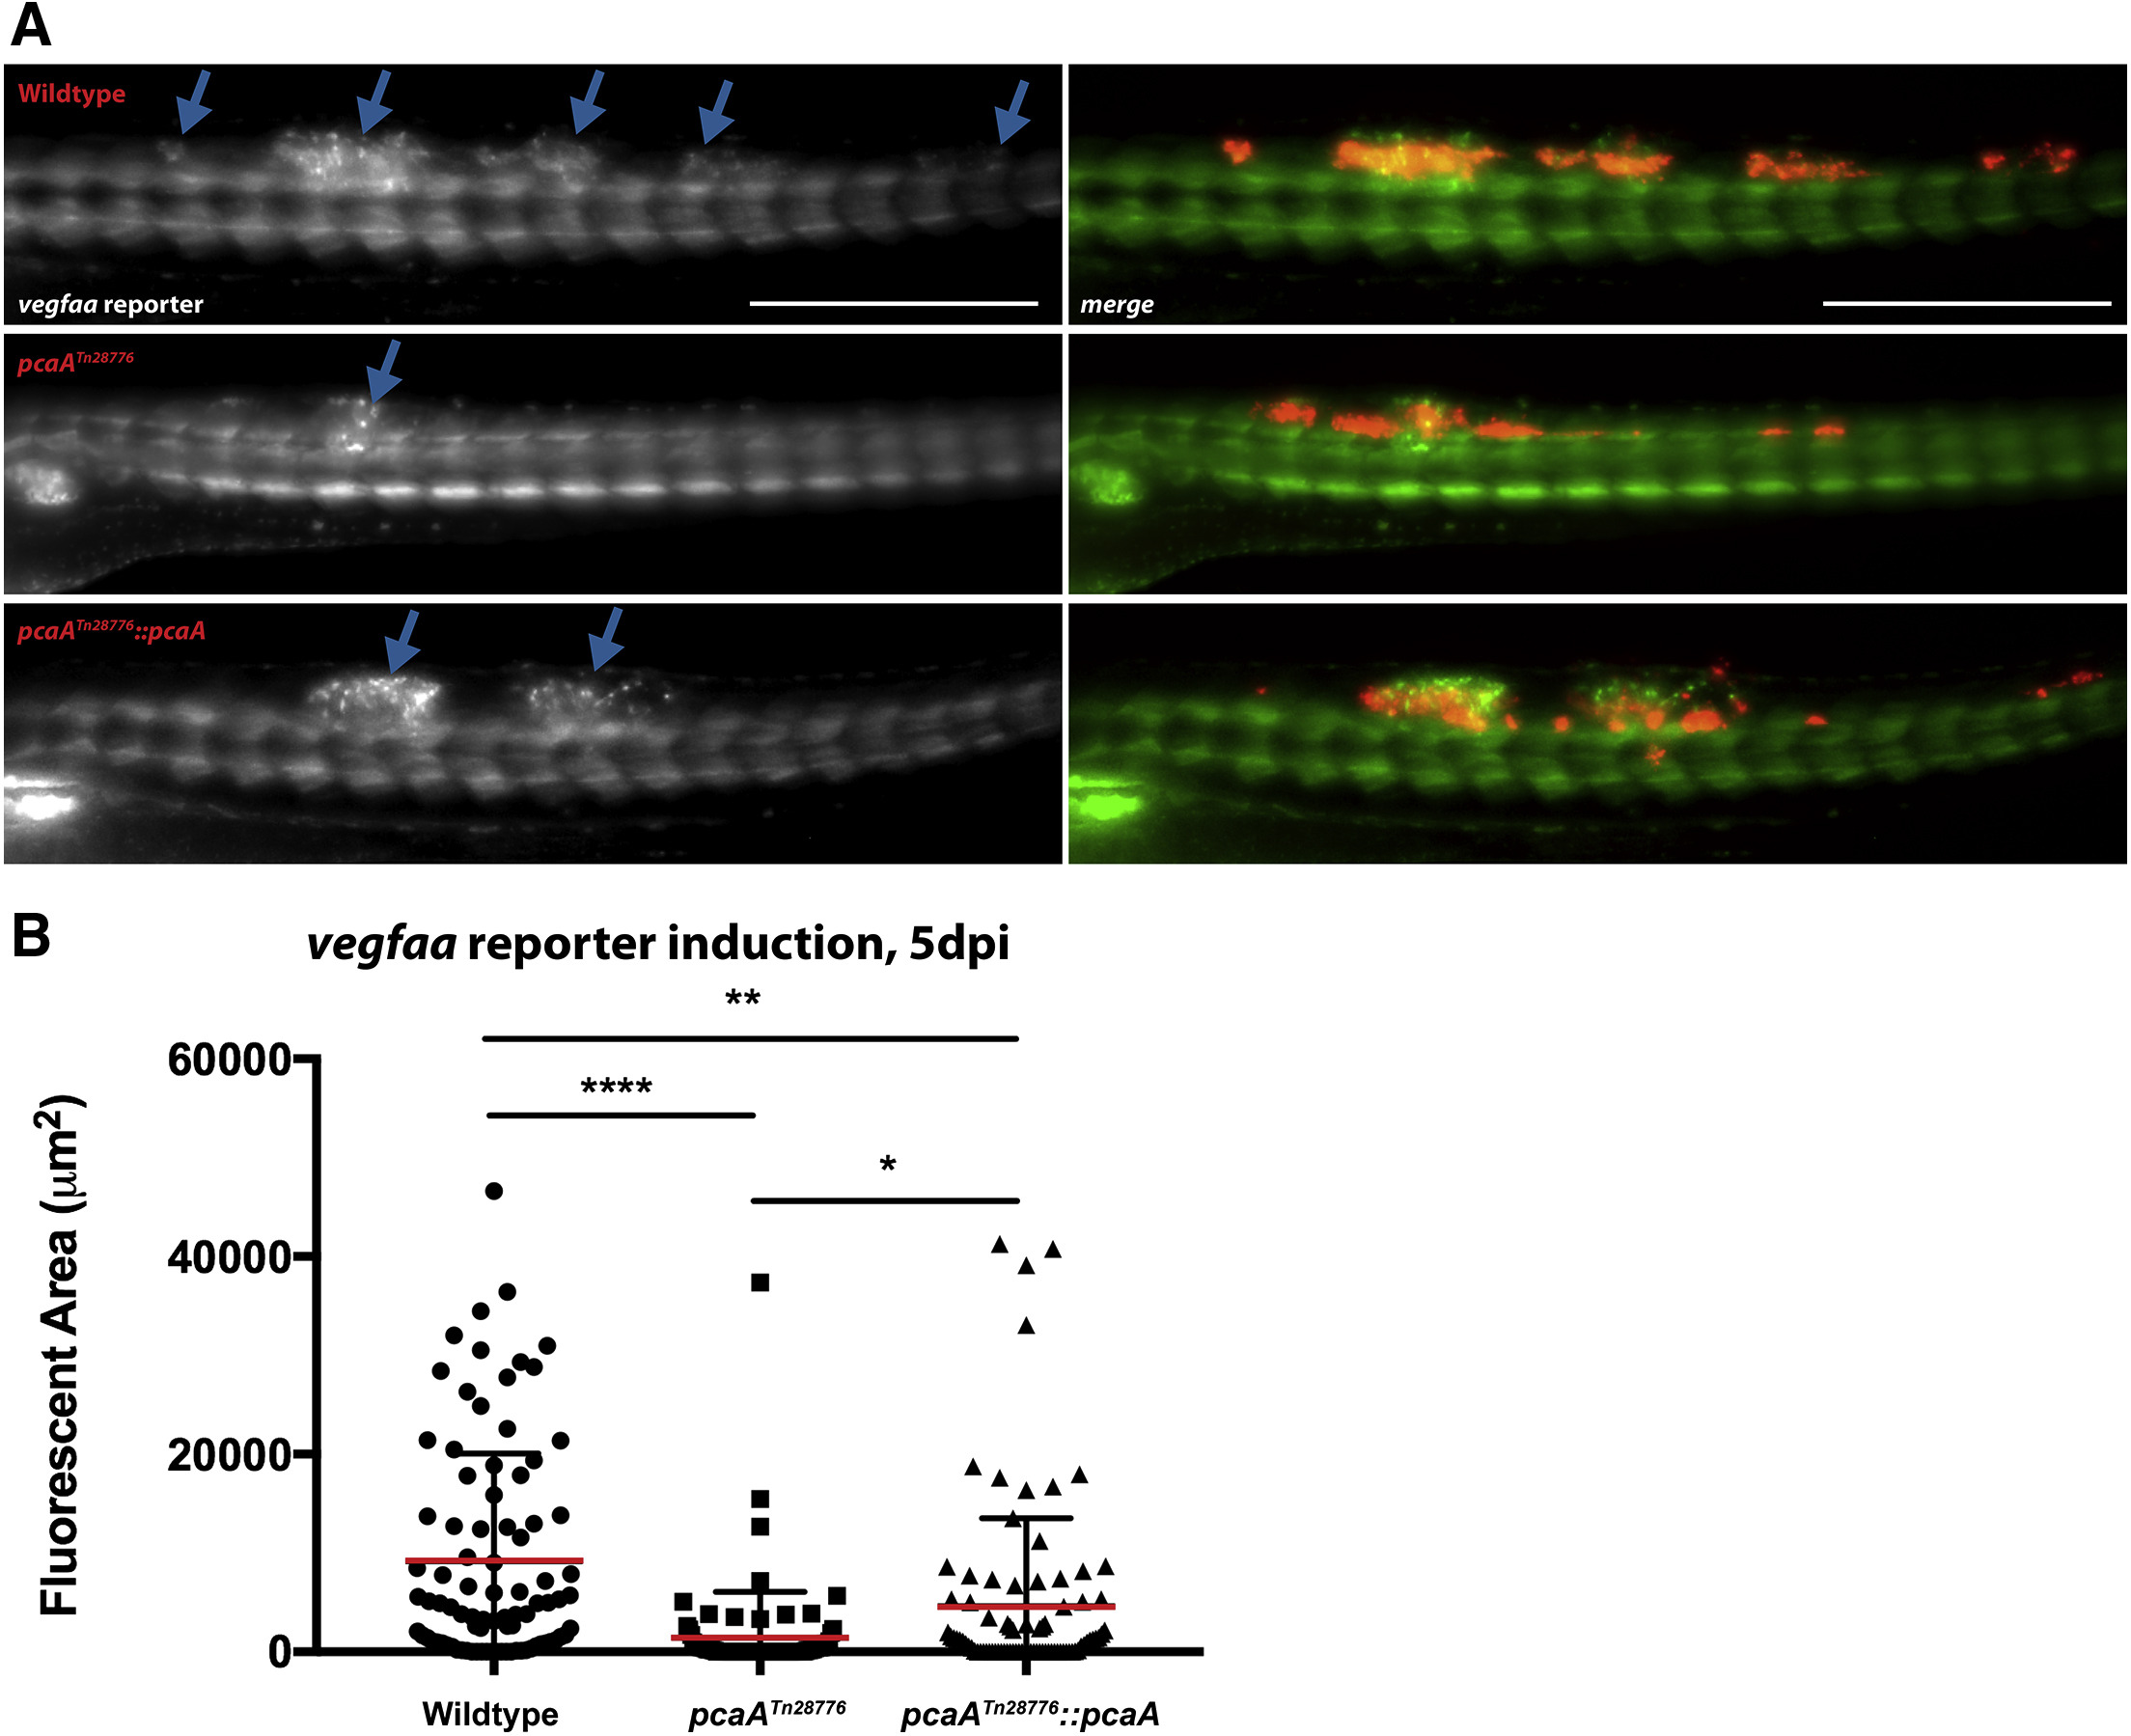
pcaA Mutants Fail to Induce Host vegfaa Reporter Expression
(A and B) Representative images of TgBAC(vegfaa:EGFP) larvae 5 dpi infected with either wild-type (top), pcaA mutant (middle), or complemented pcaA mutant M. marinum (bottom). Blue arrows denote areas of GFP signal above normal developmental pattern (A). Scale bars, 500 μm. Quantification of GFP signal above baseline for wild-type, pcaA mutant, and complemented pcaA mutant larval infections. Data from three experiments combined. ∗p < 0.05; ∗∗p < 0.01; ∗∗∗∗p < 0.0001; one-way ANOVA with Tukey's multiple comparison post-test. n = 88 for wild-type infections; n = 86 for pcaA mutant; n = 86 for complemented mutant (B).