
Fig. 1
- ID
- ZDB-IMAGE-181116-48
- Publication
- Walton et al., 2018 - Cyclopropane Modification of Trehalose Dimycolate Drives Granuloma Angiogenesis and Mycobacterial Growth through Vegf Signaling
- All Figures
- Figures for Walton et al., 2018
|
Fig. 1
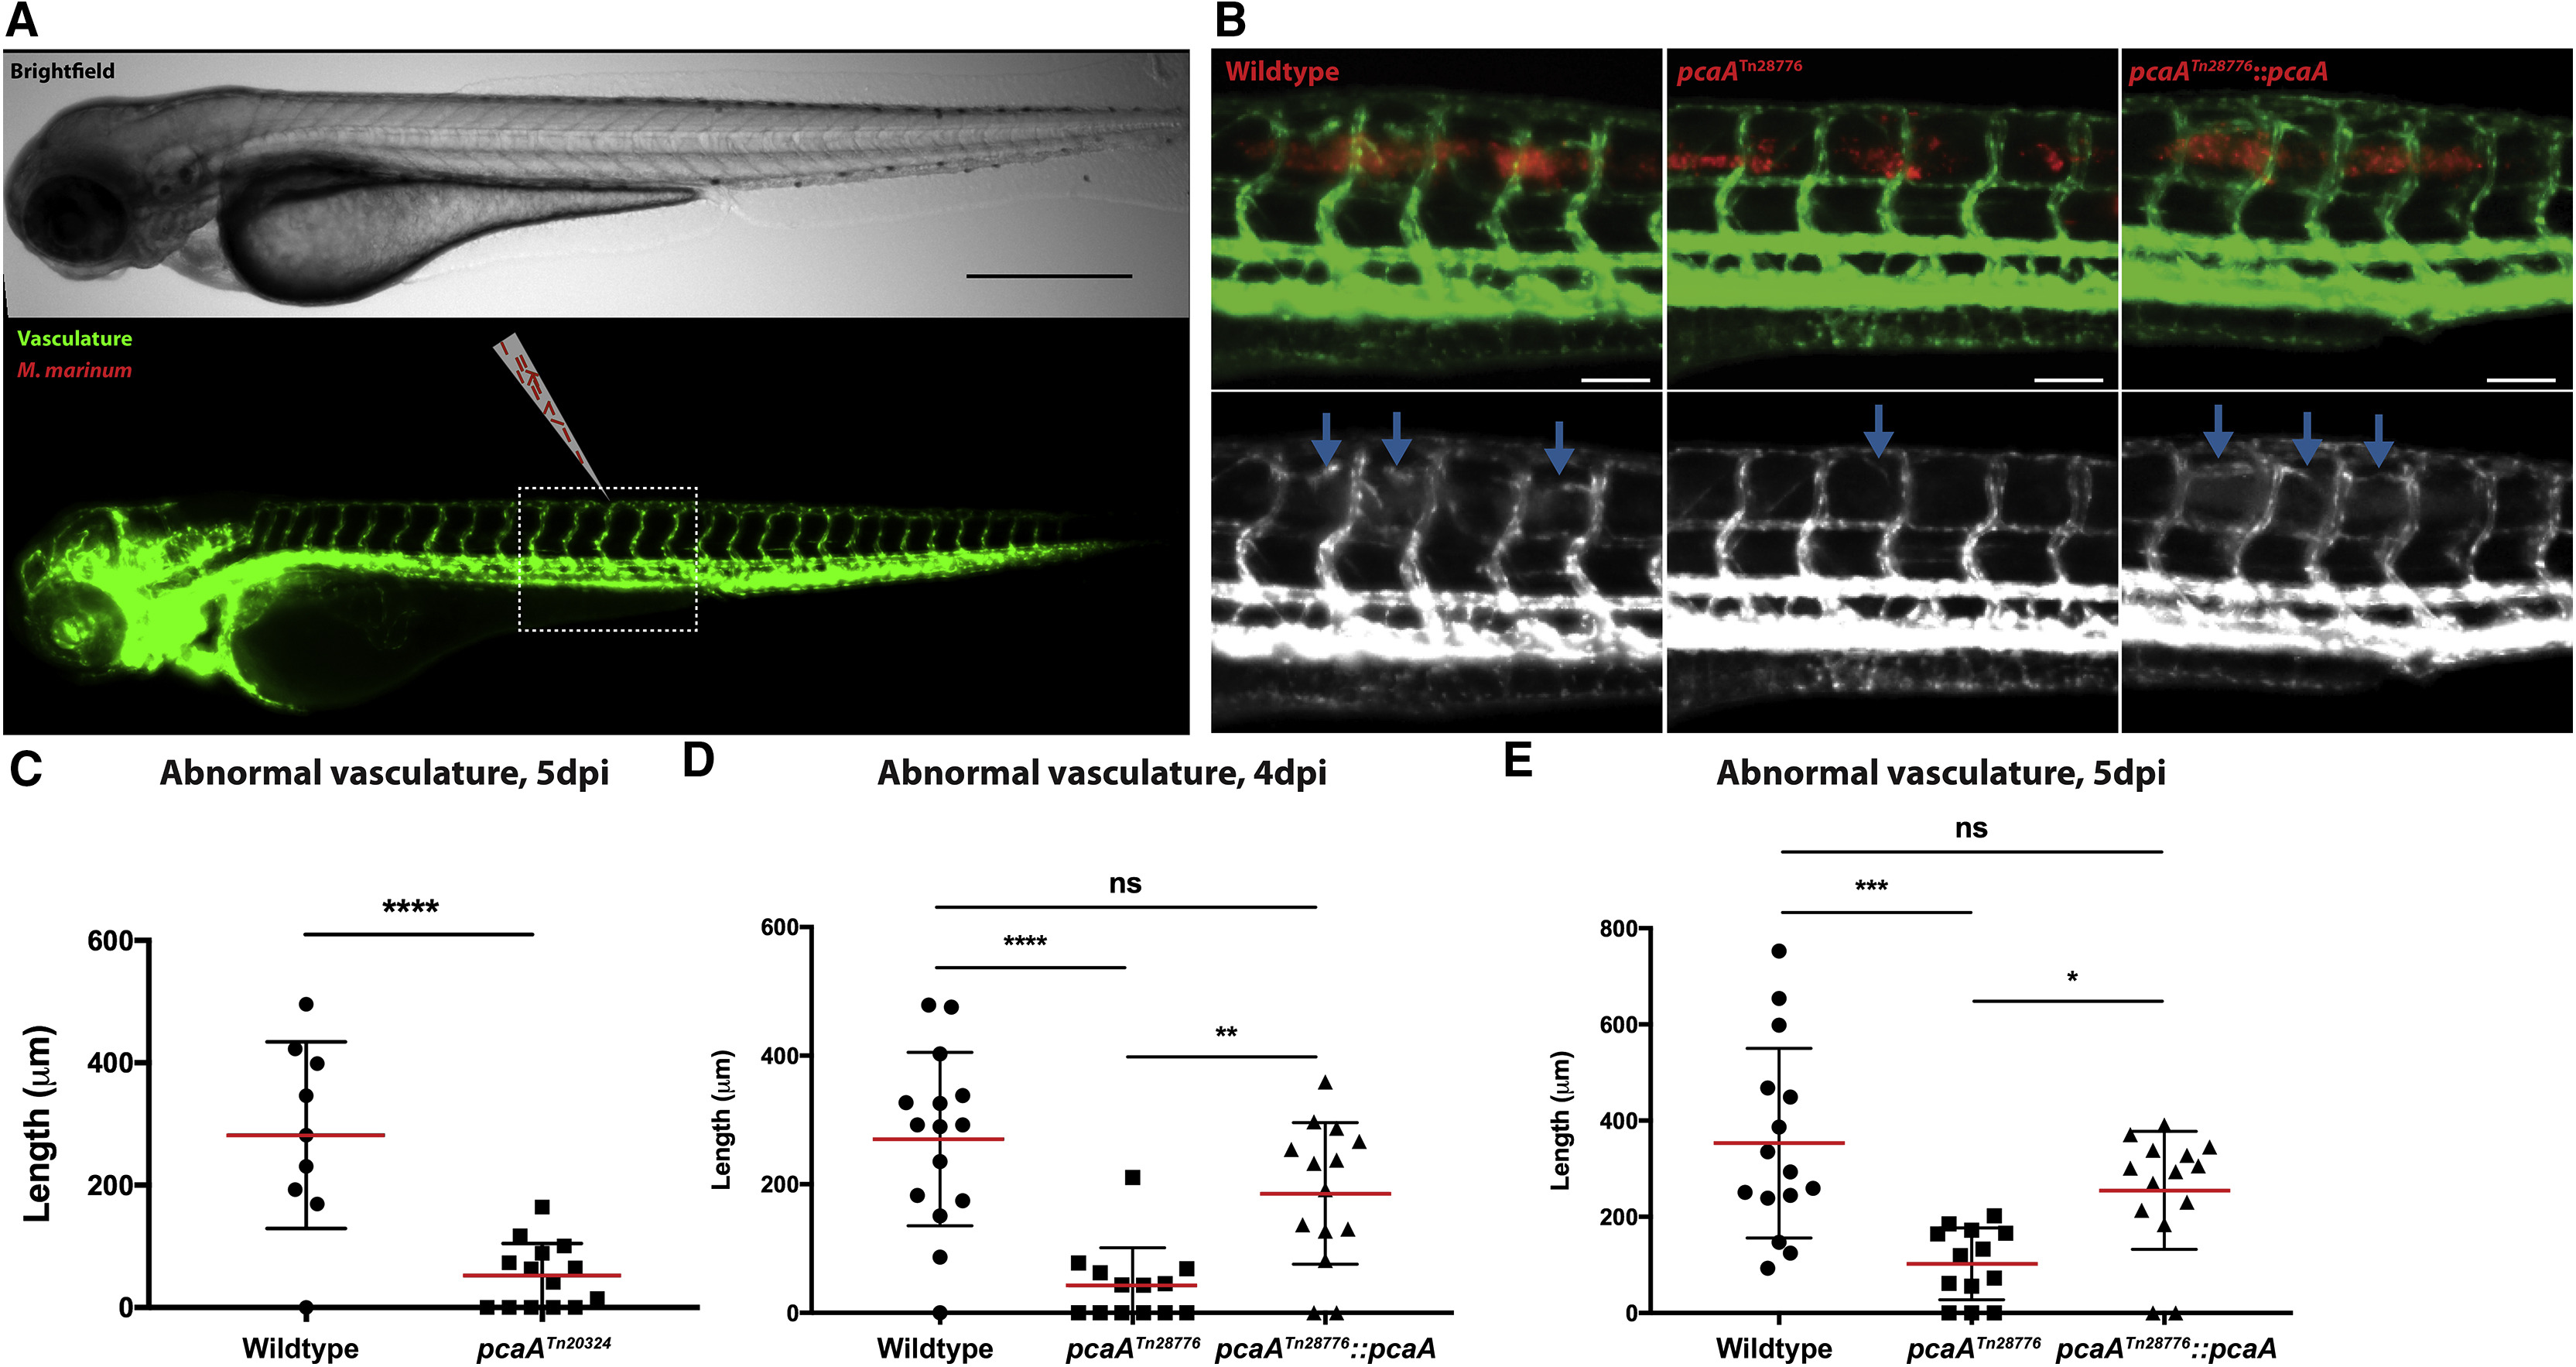
Mutations in pcaA Result in Angiogenesis-Deficient Infection Foci
(A) Depiction of the M. marinum injection site within the trunk of a zebrafish larva. Bright-field and GFP channels (upper and lower panels, respectively) are shown for clarity. Dotted line indicates approximate area shown for images in (B). Scale bar, 500 μm.
(B–E) Representative images of larvae at 4 days post-infection (dpi) infected with either wild-type, pcaATn28776, or complemented mutant M. marinum. Bacteria in red, vasculature in green (upper panels) or white (lower panels). Blue arrows denote infection-associated angiogenesis (B). Length of abnormal vasculature at 5 dpi for infections with pcaATn20324 (C) and 4 and 5 dpi for pcaATn28776 (D and E). Representative of more than three independent experiments for each mutant.
Scale bars, 100 μm. For experiment involving pcaATn20324, ∗∗∗∗p < 0.0001; Student's t test. For all other statistics, ∗p < 0.05; ∗∗p < 0.01; ∗∗∗p < 0.001; ∗∗∗∗p < 0.0001; one-way ANOVA with Tukey's multiple comparison post-test.