
|
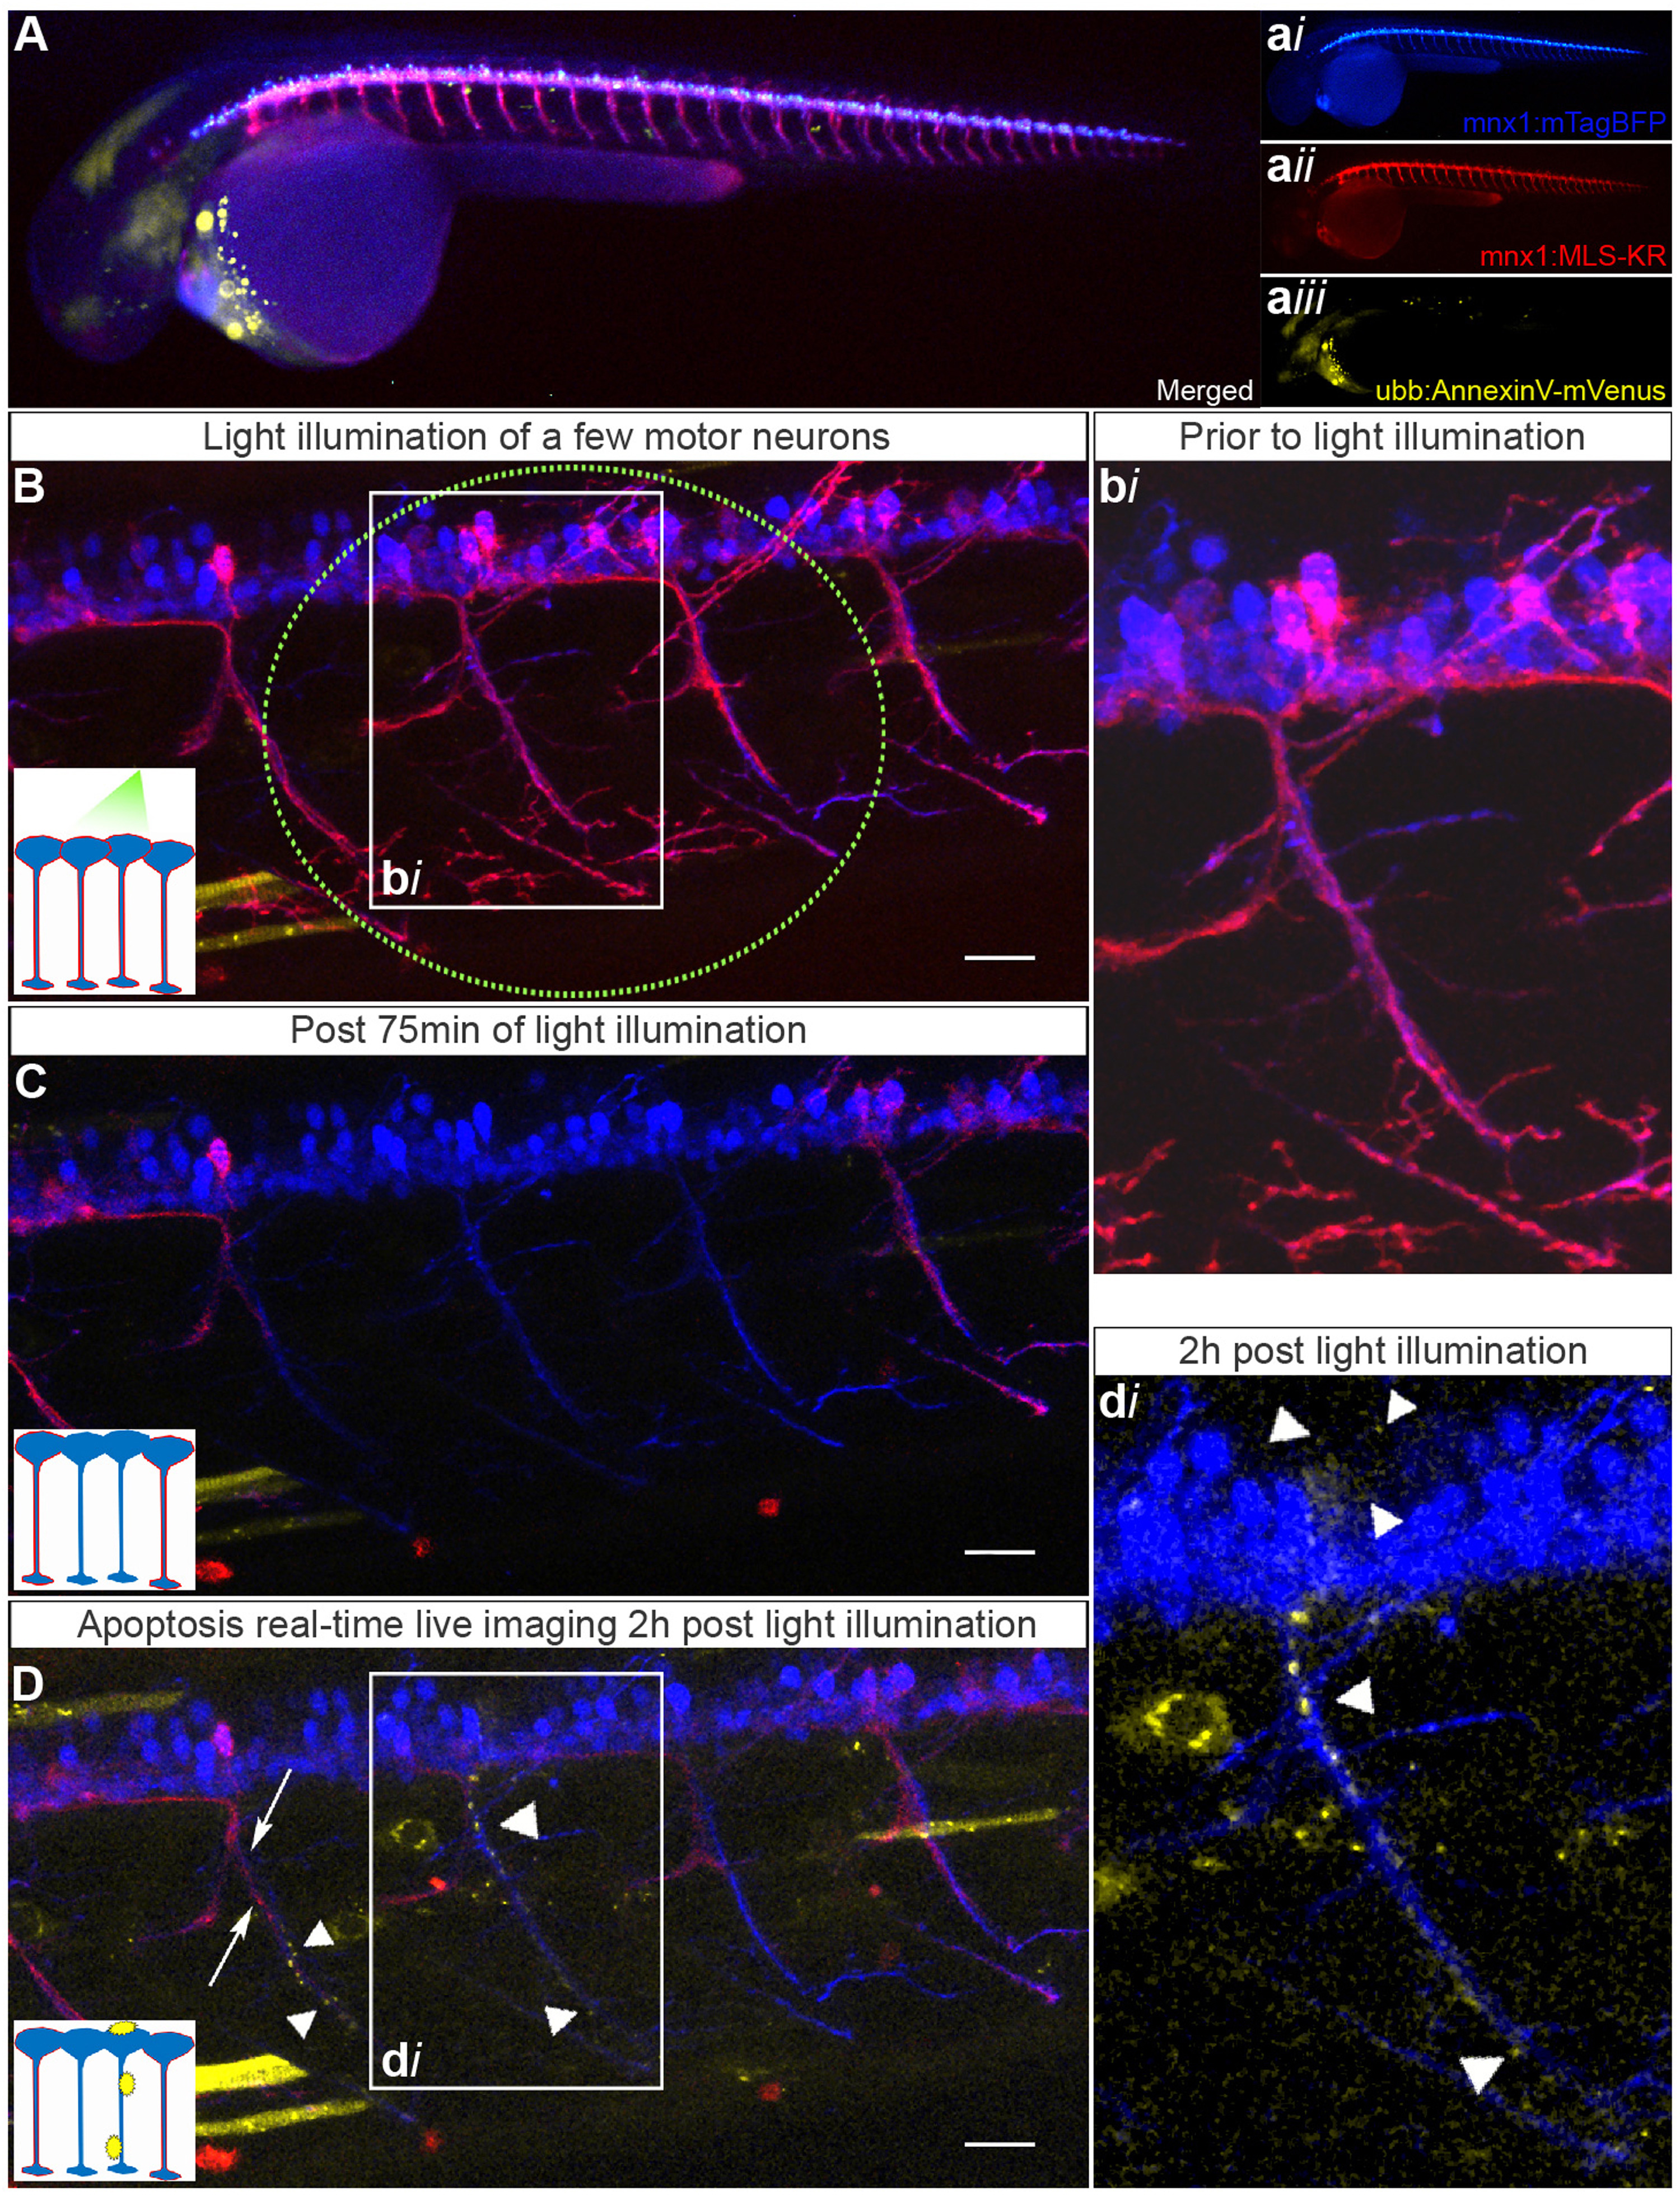
Fig. 5
KR activation lead to ANNEXINV (A5) accumulation and degeneration of MNs. (A) Triple fluorescent zebrafish (2 dpf) positive for KR (red) and TagBFP (blue) selectively in MNs, as well ubiquitous expression of A5 (yellow), were used to visualise apoptotic processes after oxidative stress induction through KR illumination. (B) Prior to light illumination within a restricted area (green dotted line) of the zebrafish spinal cord, MNs showed high intensities of KR and TagBFP expression (bi). (C) Following light illumination for 75 min the fluorescence intensity of KR (red) was markedly reduced in the light-exposed region while no changes in TagBFP-intensities could be observed. (D) Time-lapse imaging following KR activation revealed A5 accumulation (di, arrowheads) along the axon and cell soma selectively within the light-activated area (2 h post-illumination). Scale bars 25 µm.