
Image
|
Figure Caption
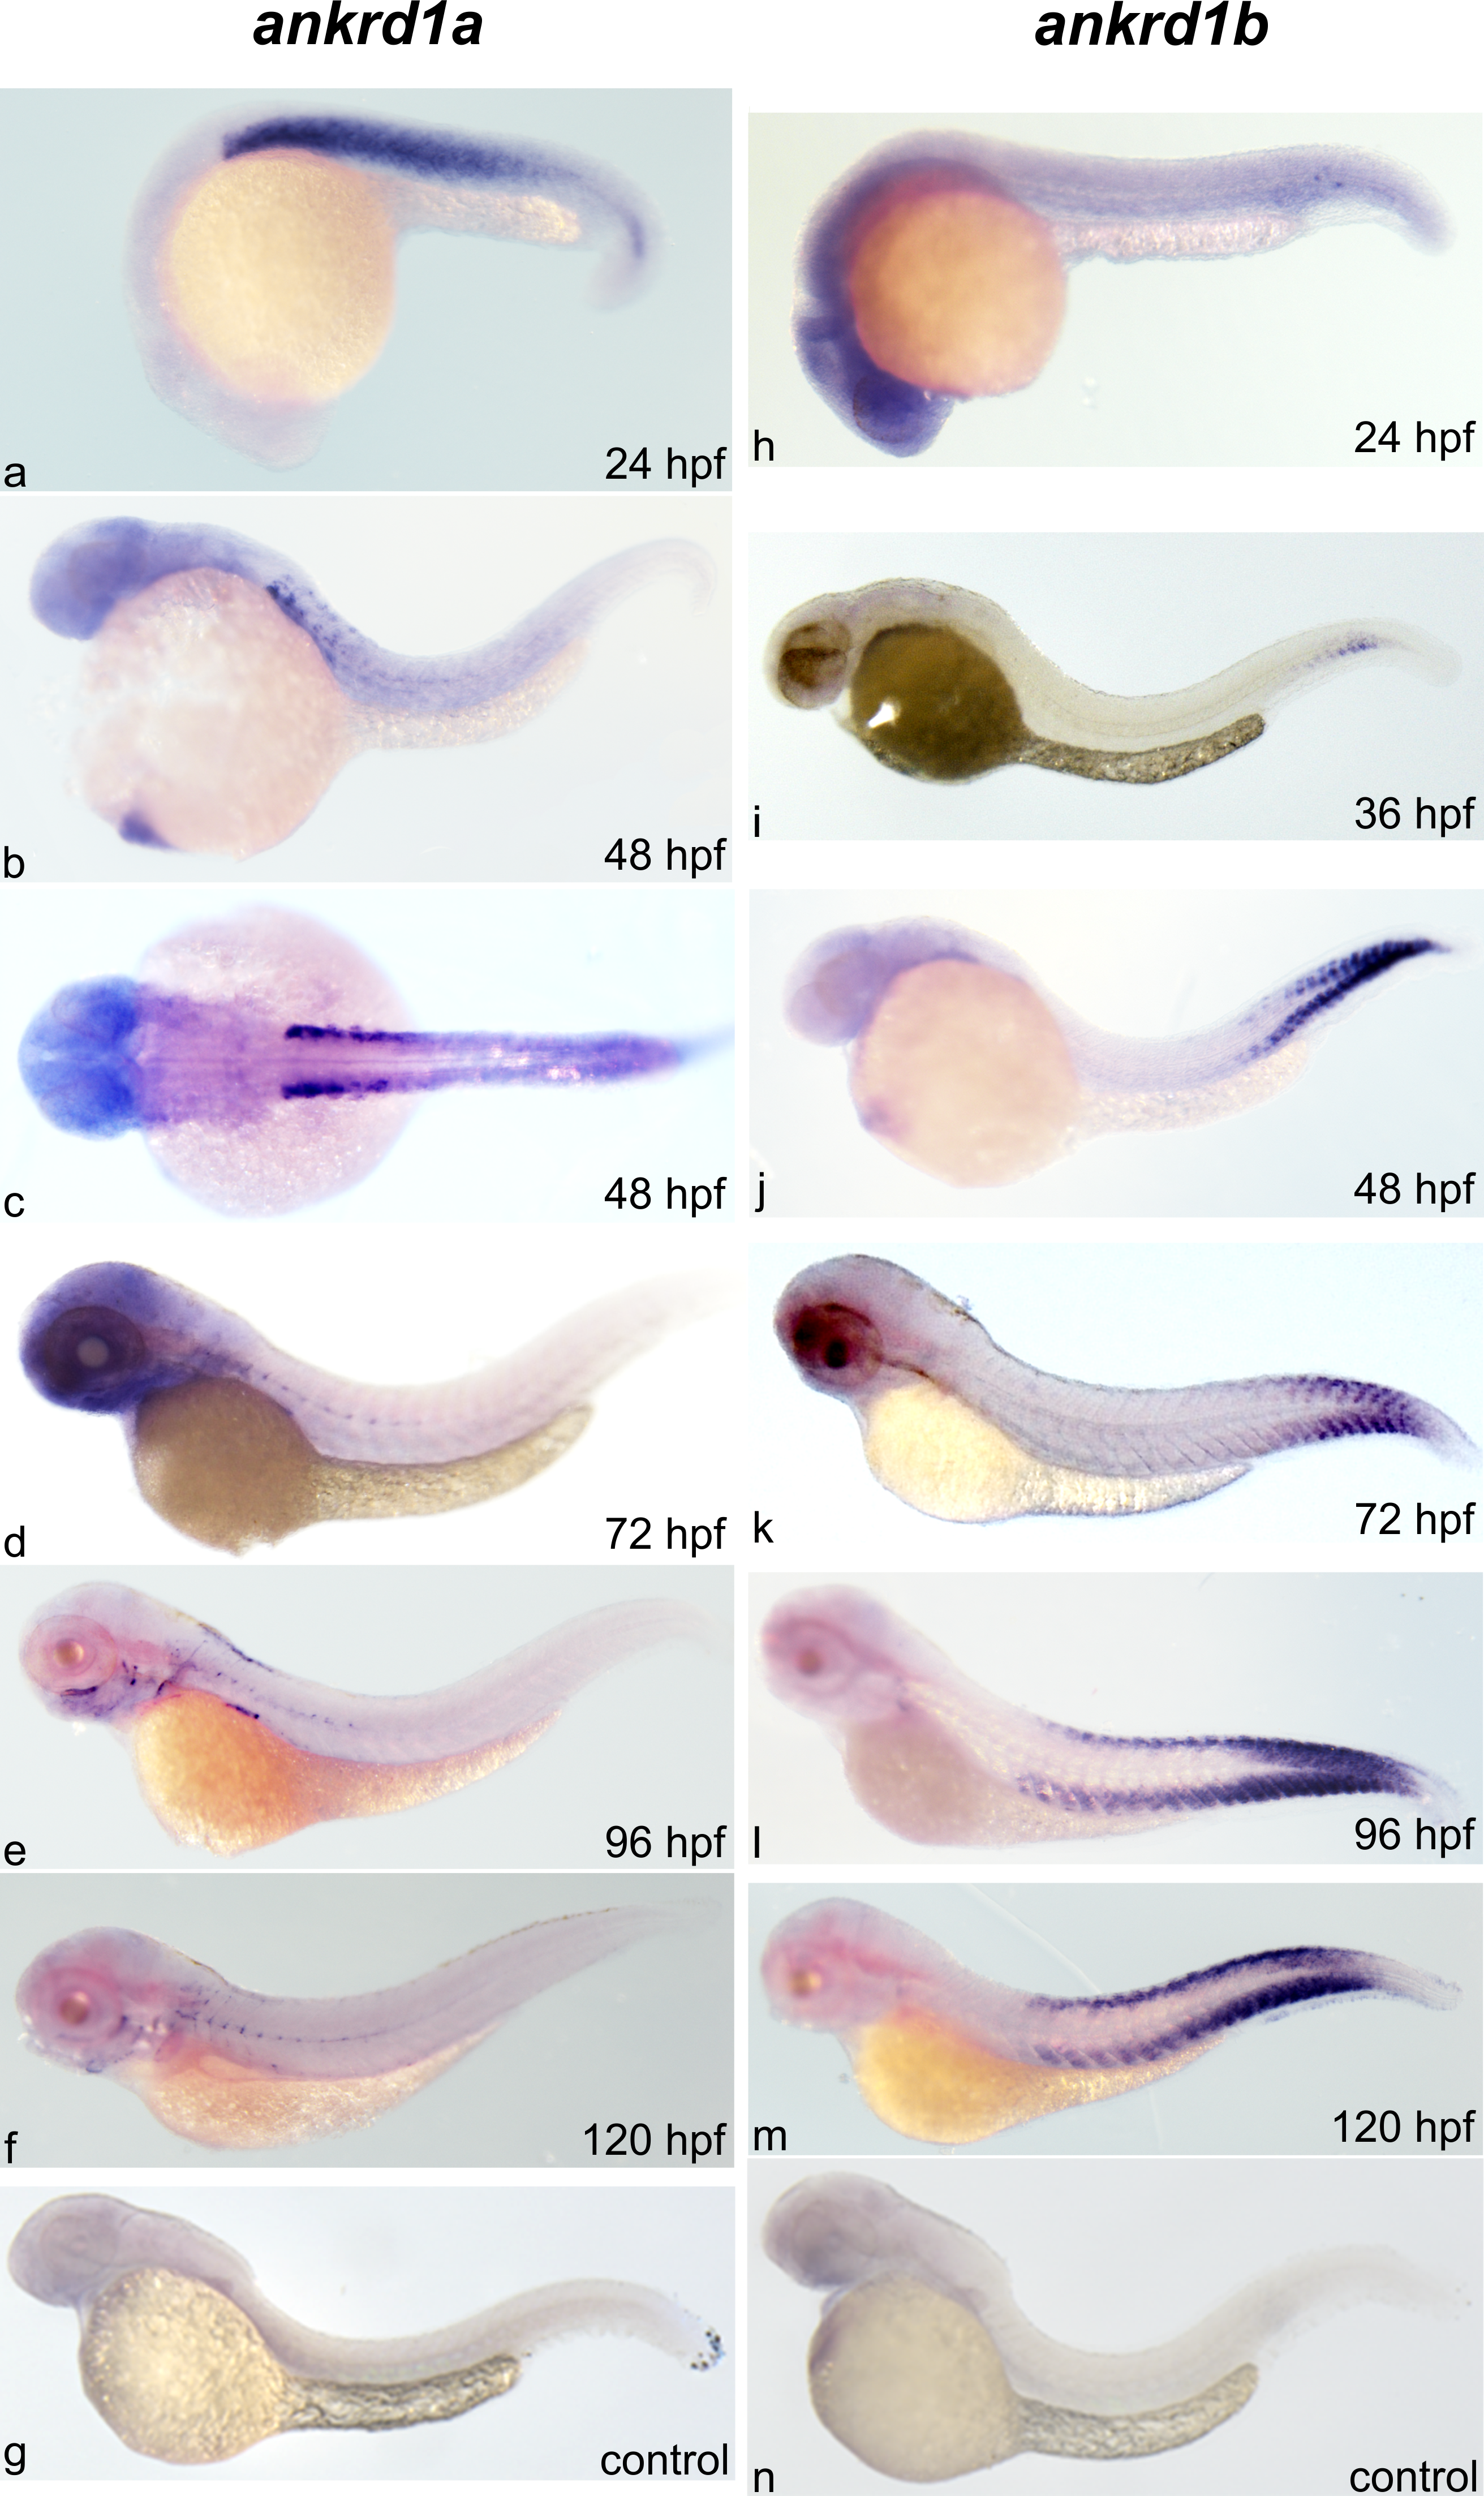
Fig. 5
Spatiotemporal expression of zebrafish ankrd1a and ankrd1b during development, from 24 to 120 hpf.
Representative images of whole mount ISH using probes detecting ankrd1a (a-f) and ankrd1b (h-m) transcripts at designated time points. Control staining for ankrd1a (g) and ankrd1b (n) was performed in 48 hpf embryos. Lateral and one dorsal (c) views are shown, anterior to the left.
Figure Data
Acknowledgments
This image is the copyrighted work of the attributed author or publisher, and
ZFIN has permission only to display this image to its users.
Additional permissions should be obtained from the applicable author or publisher of the image.
Full text @ PLoS One