
|
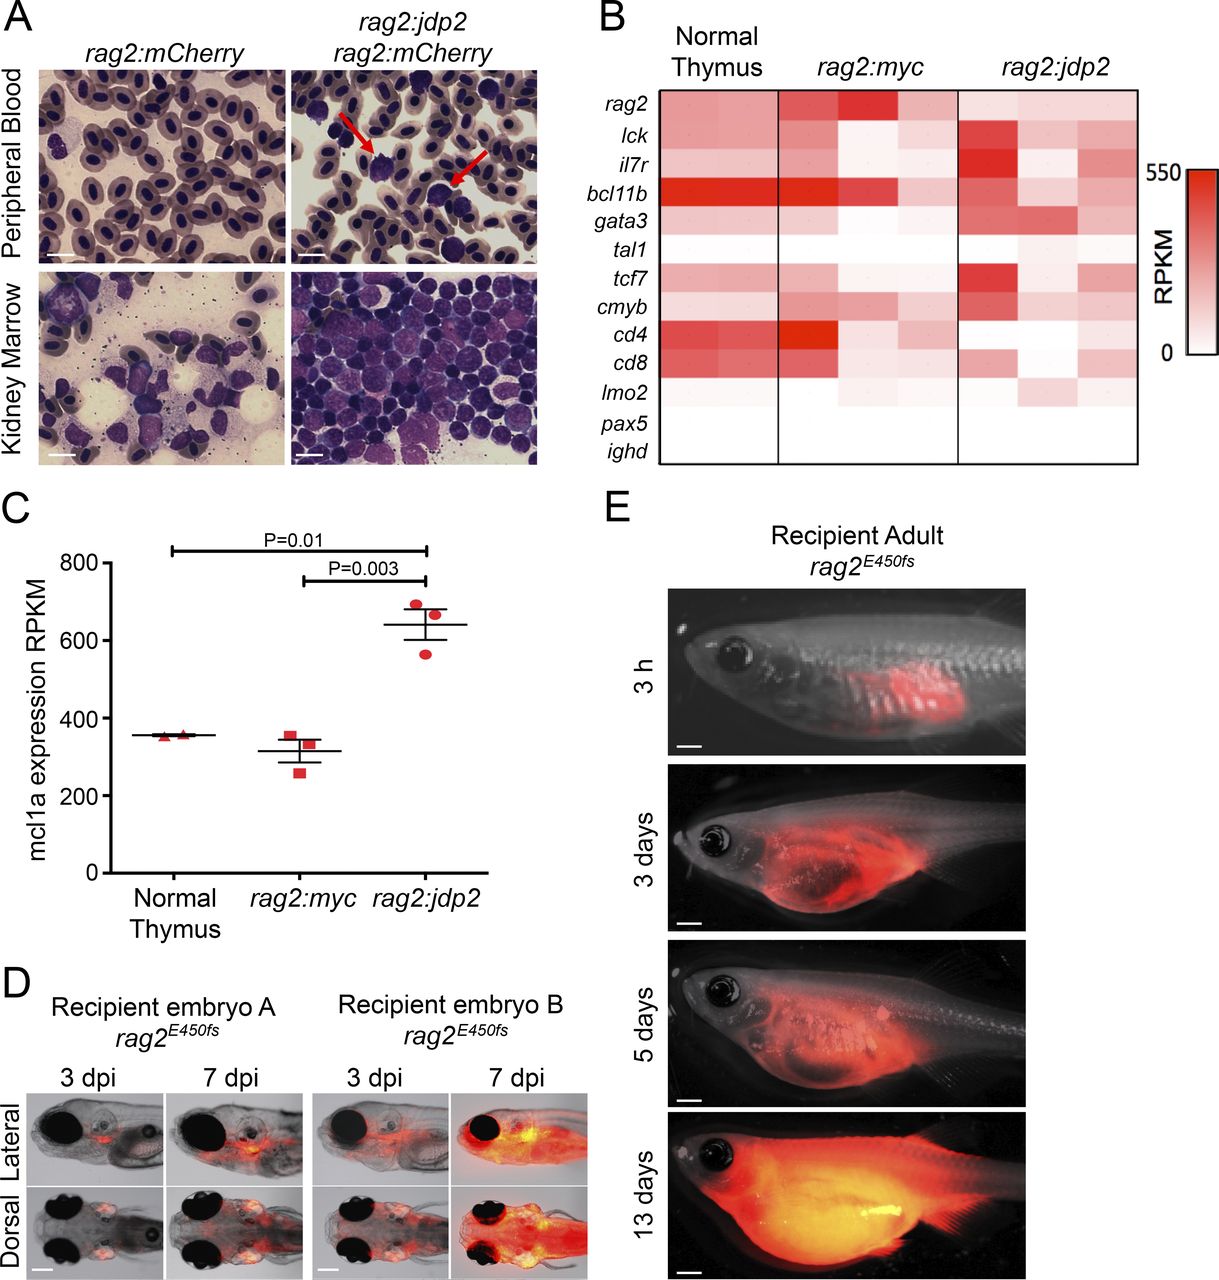
Fig. 6
Jdp2initiates a transplantable T-ALL when expressed from the rag2 promoter. (A) Hematoxylin and eosin staining of peripheral blood and kidney marrow smears from 11-mo-old Tg(rag2:mCherry) and Tg(rag2:jdp2) fish. Note that red blood cells are nucleated in normal zebrafish. Black arrow identifies a mature myeloid cell, and red arrows, circulating blast cells. Bars, 10 µm. (B) Heatmap showing expression of selected genes from FACS-purified cells from normal thymocytes from Tg(rag2:mCherry) zebrafish (each column n = 10 pooled), and tumors from Tg(rag2:jdp2) and Tg(rag2:Myc) fish (each column represents an individual fish), as determined by RNA-seq. RPKM, reads per kilobase of exon per million fragments mapped. (C) mcl1a expression by RNA-seq analysis of FACS-purified fluorescent cells. For the Tg(rag2:Myc) and Tg(rag2:jdp2) genotypes, each data point represents an individual fish, whereas for normal thymus, each point represents pooled cells harvested from 10 Tg(rag2:mCherry) animals. (D) Tumor cells were harvested from Tg(rag2:jdp2) fish and injected into the circulation of 2-d-old recipient fish homozygous for a hypomorphic rag2 allele (E450fs). Two representative embryos are shown, and findings were validated in two independent experiments. Bars, 0.1 mm. (E) Tumor cells harvested from Tg(rag2:jdp2) fish were injected into the peritoneum of adult homozygous rag2E450fs fish. Recipients were monitored by fluorescence imaging. Findings were validated in three independent experiments. Bars, 0.5 mm.