
Fig. 2
- ID
- ZDB-IMAGE-181024-19
- Antibodies
- Publication
- Swaminathan et al., 2018 - Non-canonical mTOR-Independent Role of DEPDC5 in Regulating GABAergic Network Development
- All Figures
- Figures for Swaminathan et al., 2018
|
Fig. 2
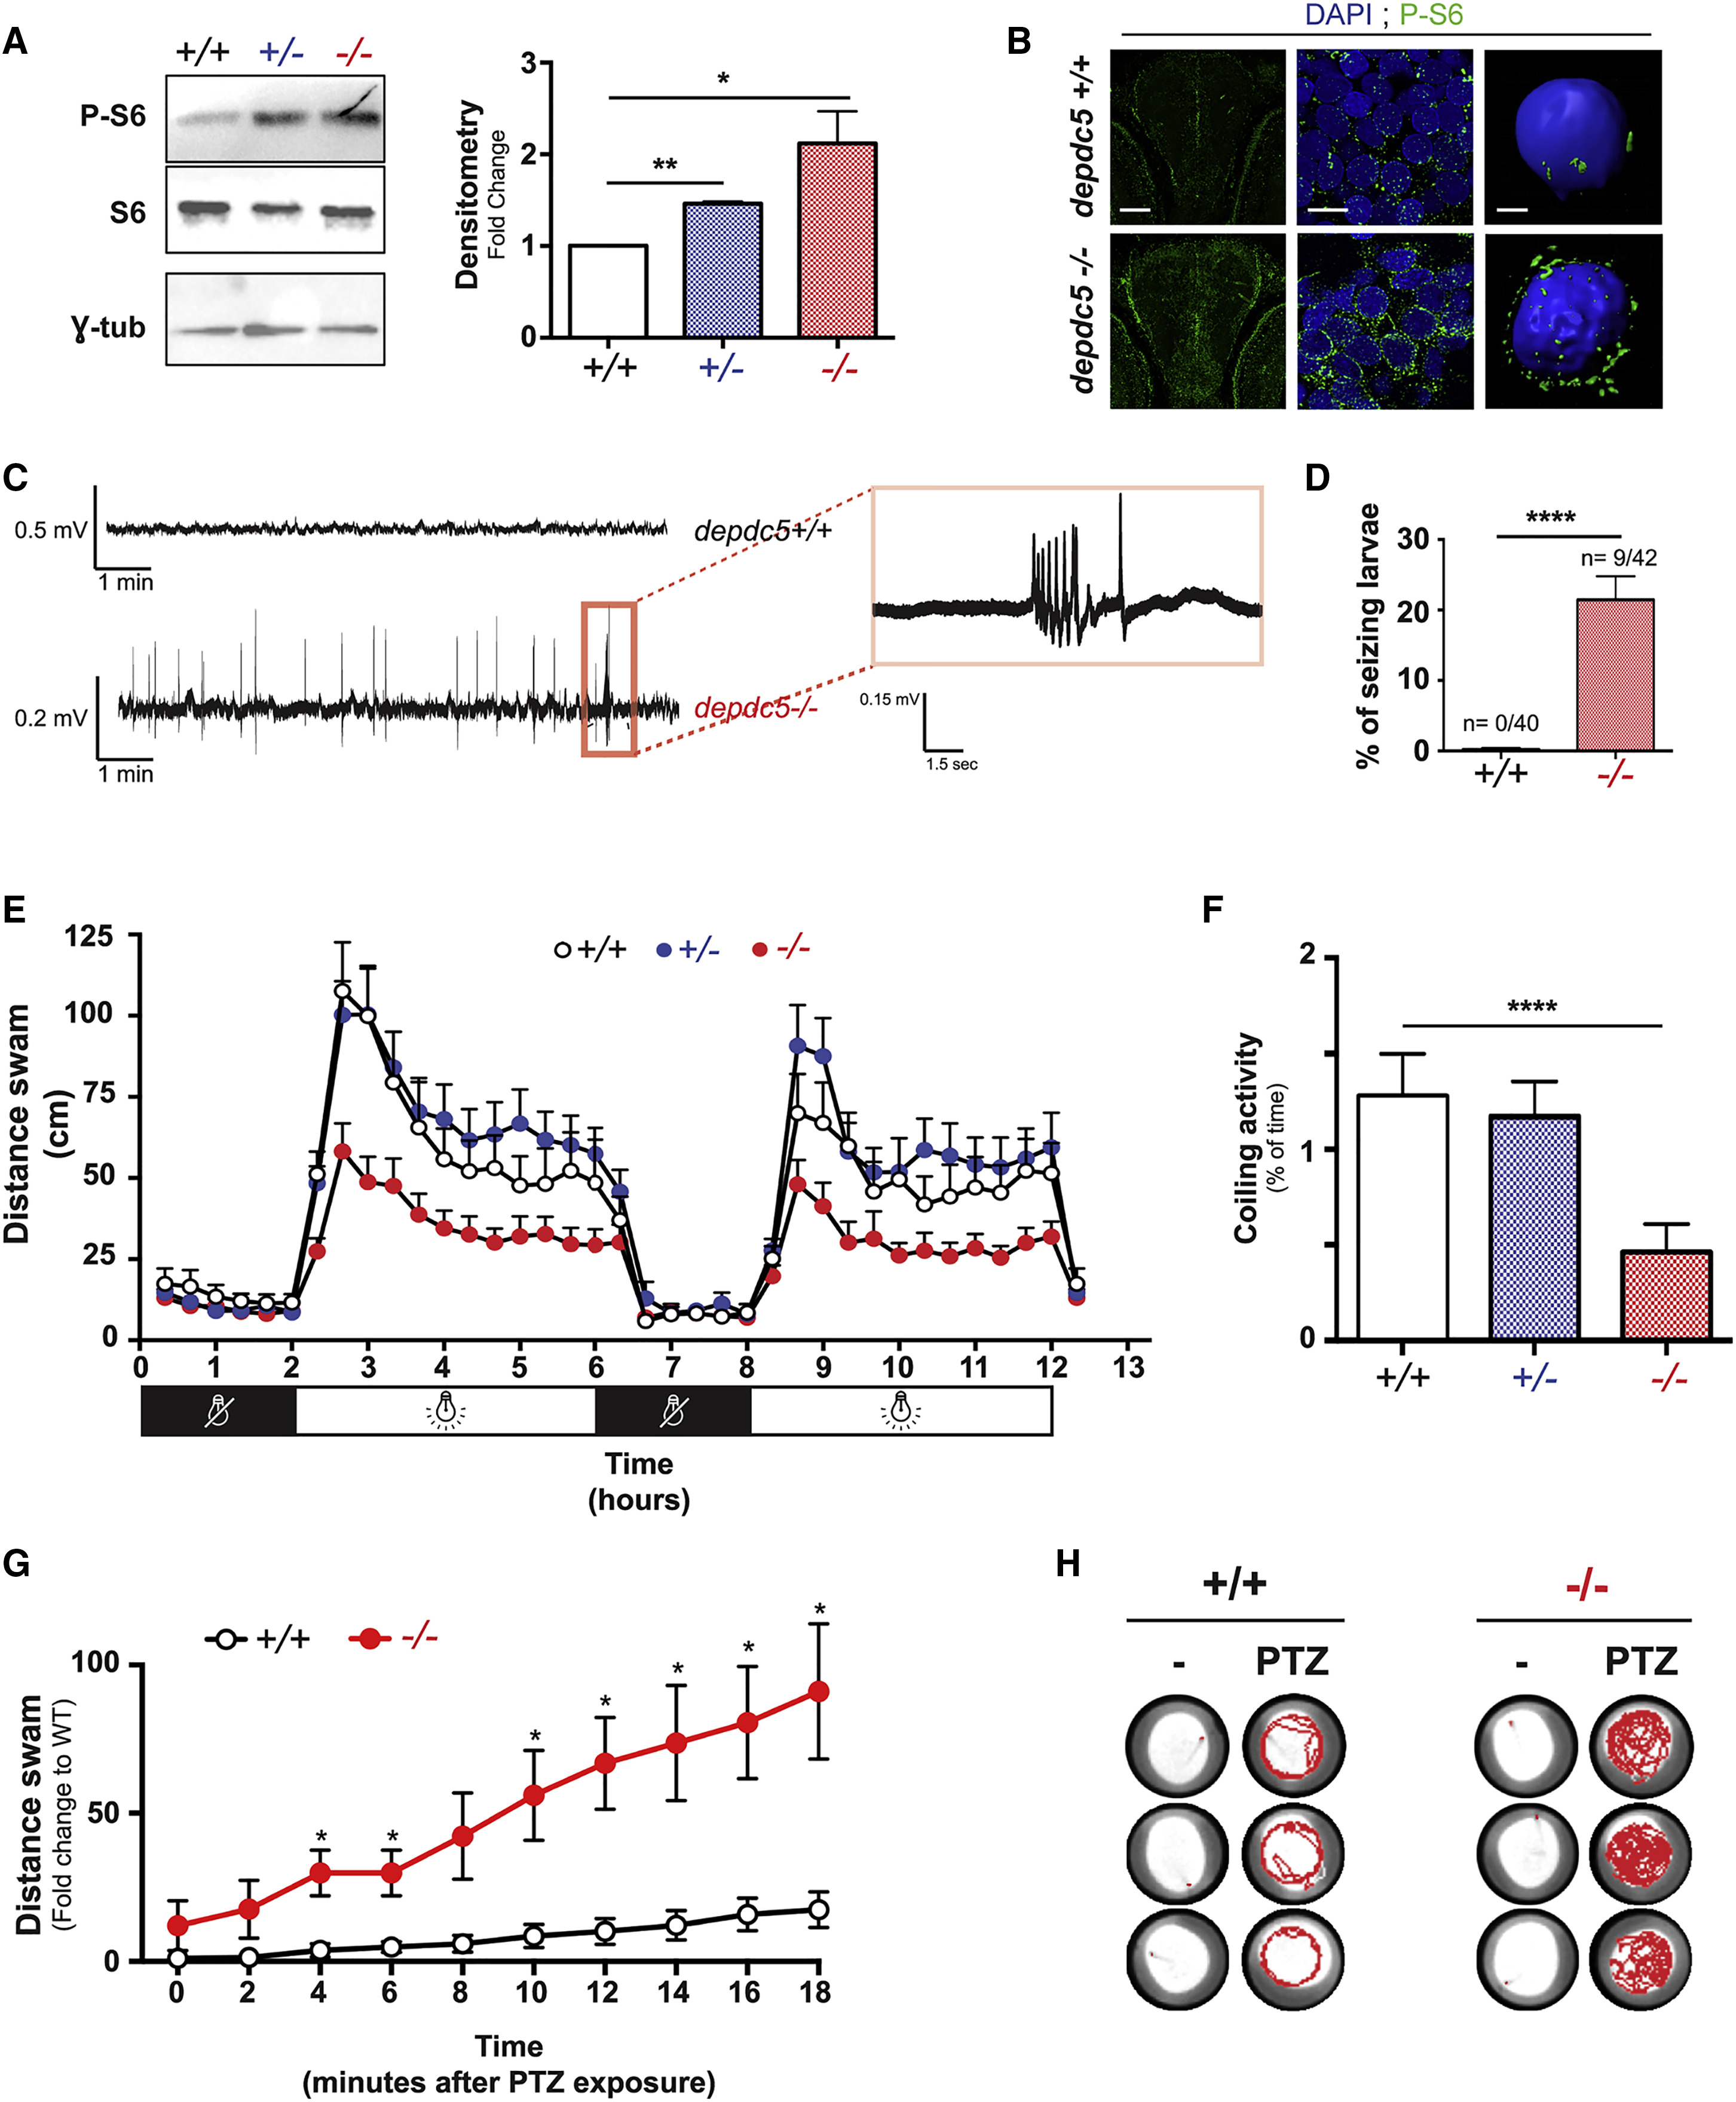
depdc5 Knockout Results in Increased mTOR Activity, Hypoactivity, Epileptiform Discharges, and Seizure Susceptibility
(A) Western blotting of 7-dpf larval lysates to examine phospho-S6 levels in depdc5+/+, depdc5+/−, and depdc5−/− larvae showing hyperactivation of mTOR signaling. n = 3; p(WT vs HT) = 0.0012; p(WT vs HM) = 0.0455.
(B) Images of 6-dpf depdc5+/+ and depdc5−/− larval brains (transversal sections across the optic tectum) immunostained with phospho-S6 antibodies and counterstained with DAPI. The panels on the extreme right depict 3D reconstruction of single cells in depdc5+/+ and −/− brains. Scale bars from left to right: 20 μm, 2.5 μm, and 1.5 μm.
(C) Spontaneous extracellular electrographic activity recorded from the optic tectum of depdc5+/+ or depdc5−/− larvae at 9 dpf showing representative epileptiform activity of depdc5−/− larvae displaying polyspiking discharges.
(D) Percentage of depdc5+/+ and depdc5−/− larvae showing epileptiform activity in the brain. N = 4, n = 10/genotype; Student’s t test p(WT vs HM) < 0.0001.
(E) Distance swam by 8-dpf larvae across two 2-hr dark/4-hr light cycles.
(F) Spontaneous coiling activity in 20-hpf embryos monitored over 20 min represented as the percentage of total time during which the embryos were active. N = 3, n = 20; Student’s t test p(WT versus HM) < 0.0001.
(G) Distance swam by 2-dpf embryos upon exposure to 3 mM PTZ represented as fold change compared to basal distance swam by wild-type larvae at t0. N = 3, n > 10; Student’s t test, ∗p < 0.05.
(H) Representative swimming tracks of 2-dpf embryos during a 10-min period following a 3 mM PTZ exposure (tracks of 3 replicates are shown in rows for each genotype).