
Fig. 2
- ID
- ZDB-IMAGE-181018-7
- Publication
- Du et al., 2018 - A transgenic zebrafish model for in vivo long-term imaging of retinotectal synaptogenesis
- All Figures
- Figures for Du et al., 2018
|
Fig. 2
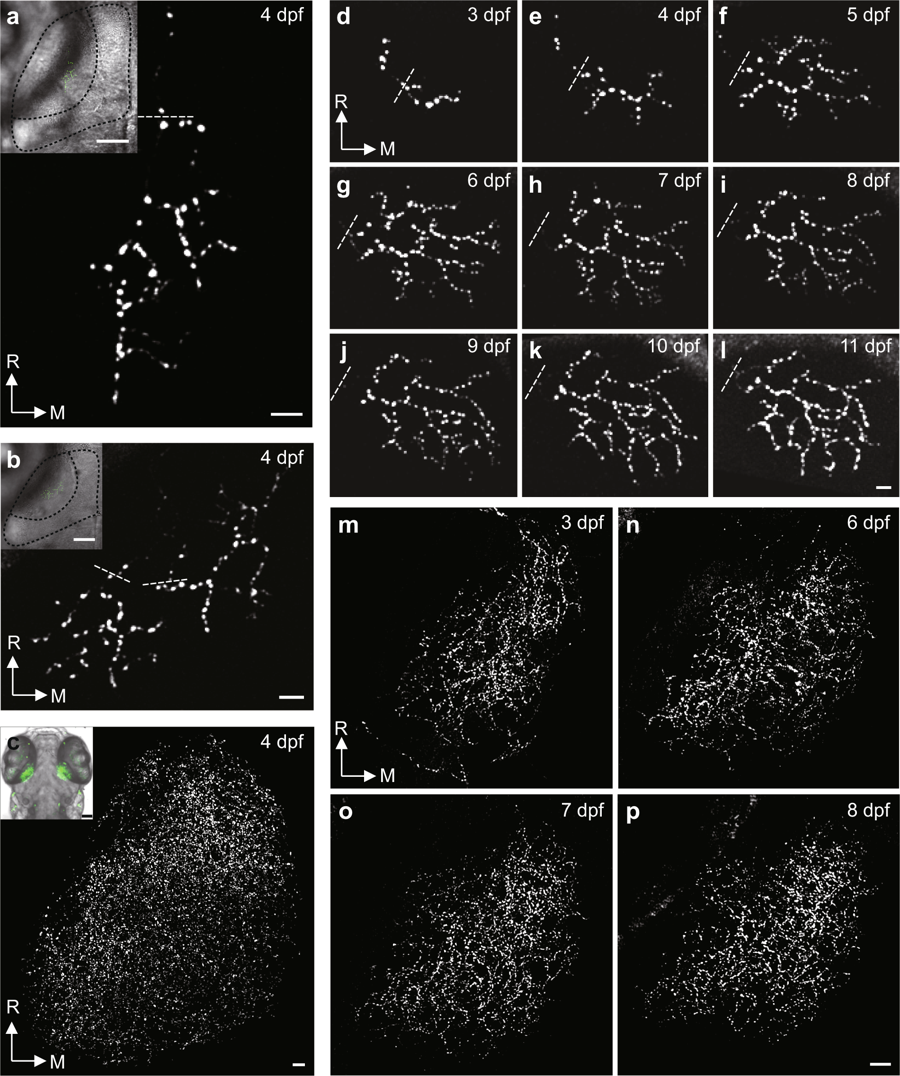
Long-term stable in vivo imaging of retinotectal pre-synaptic terminals in PGUSG larvae with single or multiple RGCs labelled. (a–c) Examples of single (a), two (b) and multiple (c) Sypb-EGFP labelled RGC axonal arbors within one tectal hemisphere from different PGUSG fish at 4 dpf. Insets, topographic position of RGC axonal arbors in the tectal neuropil. In each inset, an optical section of bright-field image and a stack of green fluorescent images are superimposed. Dashed black curve, the profiles of half tectum and half neuropil. (d–p) Time series showing maximum-intensity-projection view of the same single (d–l) and multiple (m–p) Sypb-EGFP labelled RGC axonal arbors at 3–11 dpf and at 3, 6, 7 and 8 dpf, respectively. Autofluorescence of the skin is visible in the right upper corner in panel (j), (k) and (l). Dashed white line, position above the first branch point of each axonal arbor. R, rostral; M, medial. Scale bar: 5 μm in each panel; 50 μm in panel inset.