
Fig. S2
- ID
- ZDB-IMAGE-181018-12
- Publication
- Du et al., 2018 - A transgenic zebrafish model for in vivo long-term imaging of retinotectal synaptogenesis
- All Figures
- Figures for Du et al., 2018
|
Fig. S2
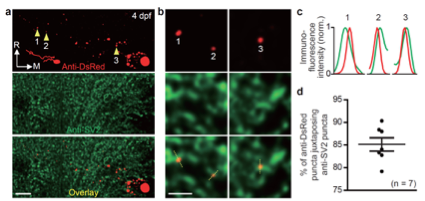
Validation of Psd95-DsRedEx as a postsynaptic marker.
(a) DsRed (top, red) and SV2 (middle, green) immunostaining of a thin horizontal cryostat section (20 μm in thickness) from a 4-dpf larva with tectal neurons sparsely labelled by Psd95-DsRedEx. M, medial; R, rostral. Scale bar, 5 μm. (b) Zoom-in views of three examples of anti-DsRed puncta (yellow arrowheads in a) juxtaposing with anti-SV2 puncta. Scale bar, 2 μm. (c) Spatial profile of the normalized immunofluorescence intensity of the three juxtapositions along the yellow dotted lines shown in (b). (d) Summary of the percentage of anti-DsRed puncta juxtaposing with anti-SV2 puncta. The juxtaposition is defined as immunofluorescence intensity overlap > 50%. The data were obtained from 7 cells in 3 larvae.