
Fig. S5
- ID
- ZDB-IMAGE-181009-12
- Publication
- Zhang et al., 2018 - Distant Insulin Signaling Regulates Vertebrate Pigmentation through the Sheddase Bace2
- All Figures
- Figures for Zhang et al., 2018
|
Fig. S5
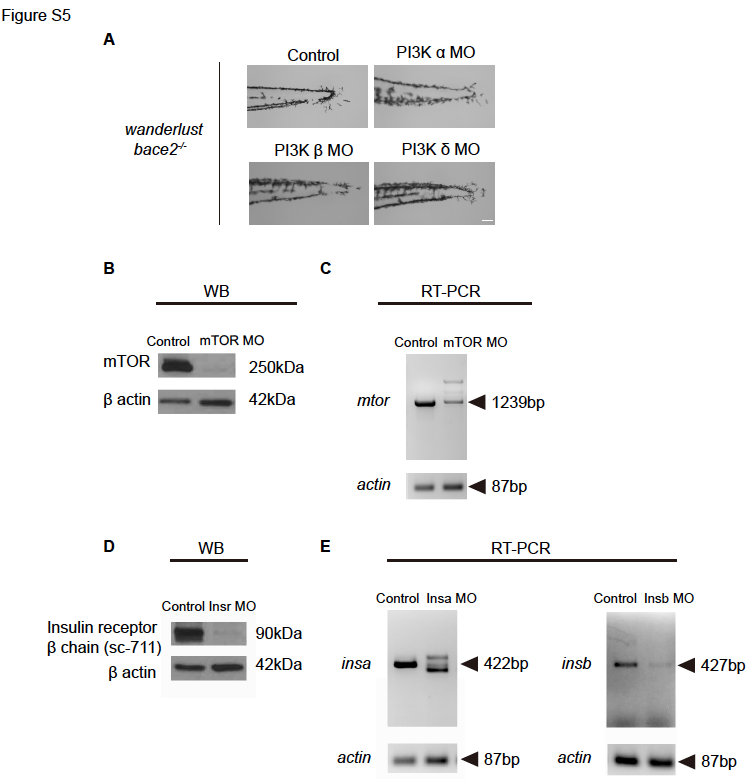
Related to Figure 4, 6, 7: Control experiments for morpholino knockdown.
(A) Knockdown of PI3K α, β or δ isoforms using morpholinos does not rescue bace2-/- dendritic melanophores to the same extent as PI3K γ morpholinos, as shown in Figure 4E. (B) Knockdown of mTOR using mTOR splicing morpholino leads to depletion of mTOR protein in Western blot. Membrane probed with anti-mTOR antibody and β-actin as a loading control. (C) RT-PCR shows knockdown of mTOR using mTOR splicing morpholino leads to abnormal mRNA splicing. mtor fragment is amplified using primers adjacent to morpholino target sites. actin: input control. (D) Western blot shows co-knockdown of insra and insrb using morpholinos leads to decrease insulin receptor protein. Membrane probed with antibody sc-711 recognizing insulin receptor β chain and β-actin as a loading control. (E) Knockdown of insa (Left) and insb (Right) using splicing morpholinos lead to abnormal mRNA splicing and expression in RT-PCR. Fragments are amplified using primers adjacent to morpholino target sites. actin: input control. Scale bars, 100μM.
Reprinted from Developmental Cell, 45(5), Zhang, Y.M., Zimmer, M.A., Guardia, T., Callahan, S.J., Mondal, C., Di Martino, J., Takagi, T., Fennell, M., Garippa, R., Campbell, N.R., Bravo-Cordero, J.J., White, R.M., Distant Insulin Signaling Regulates Vertebrate Pigmentation through the Sheddase Bace2, 580-594.e7, Copyright (2018) with permission from Elsevier. Full text @ Dev. Cell