
Fig. 3
- ID
- ZDB-IMAGE-181004-3
- Genes
- Publication
- Wu et al., 2018 - Il34-Csf1r Pathway Regulates the Migration and Colonization of Microglial Precursors
- All Figures
- Figures for Wu et al., 2018
|
Fig. 3
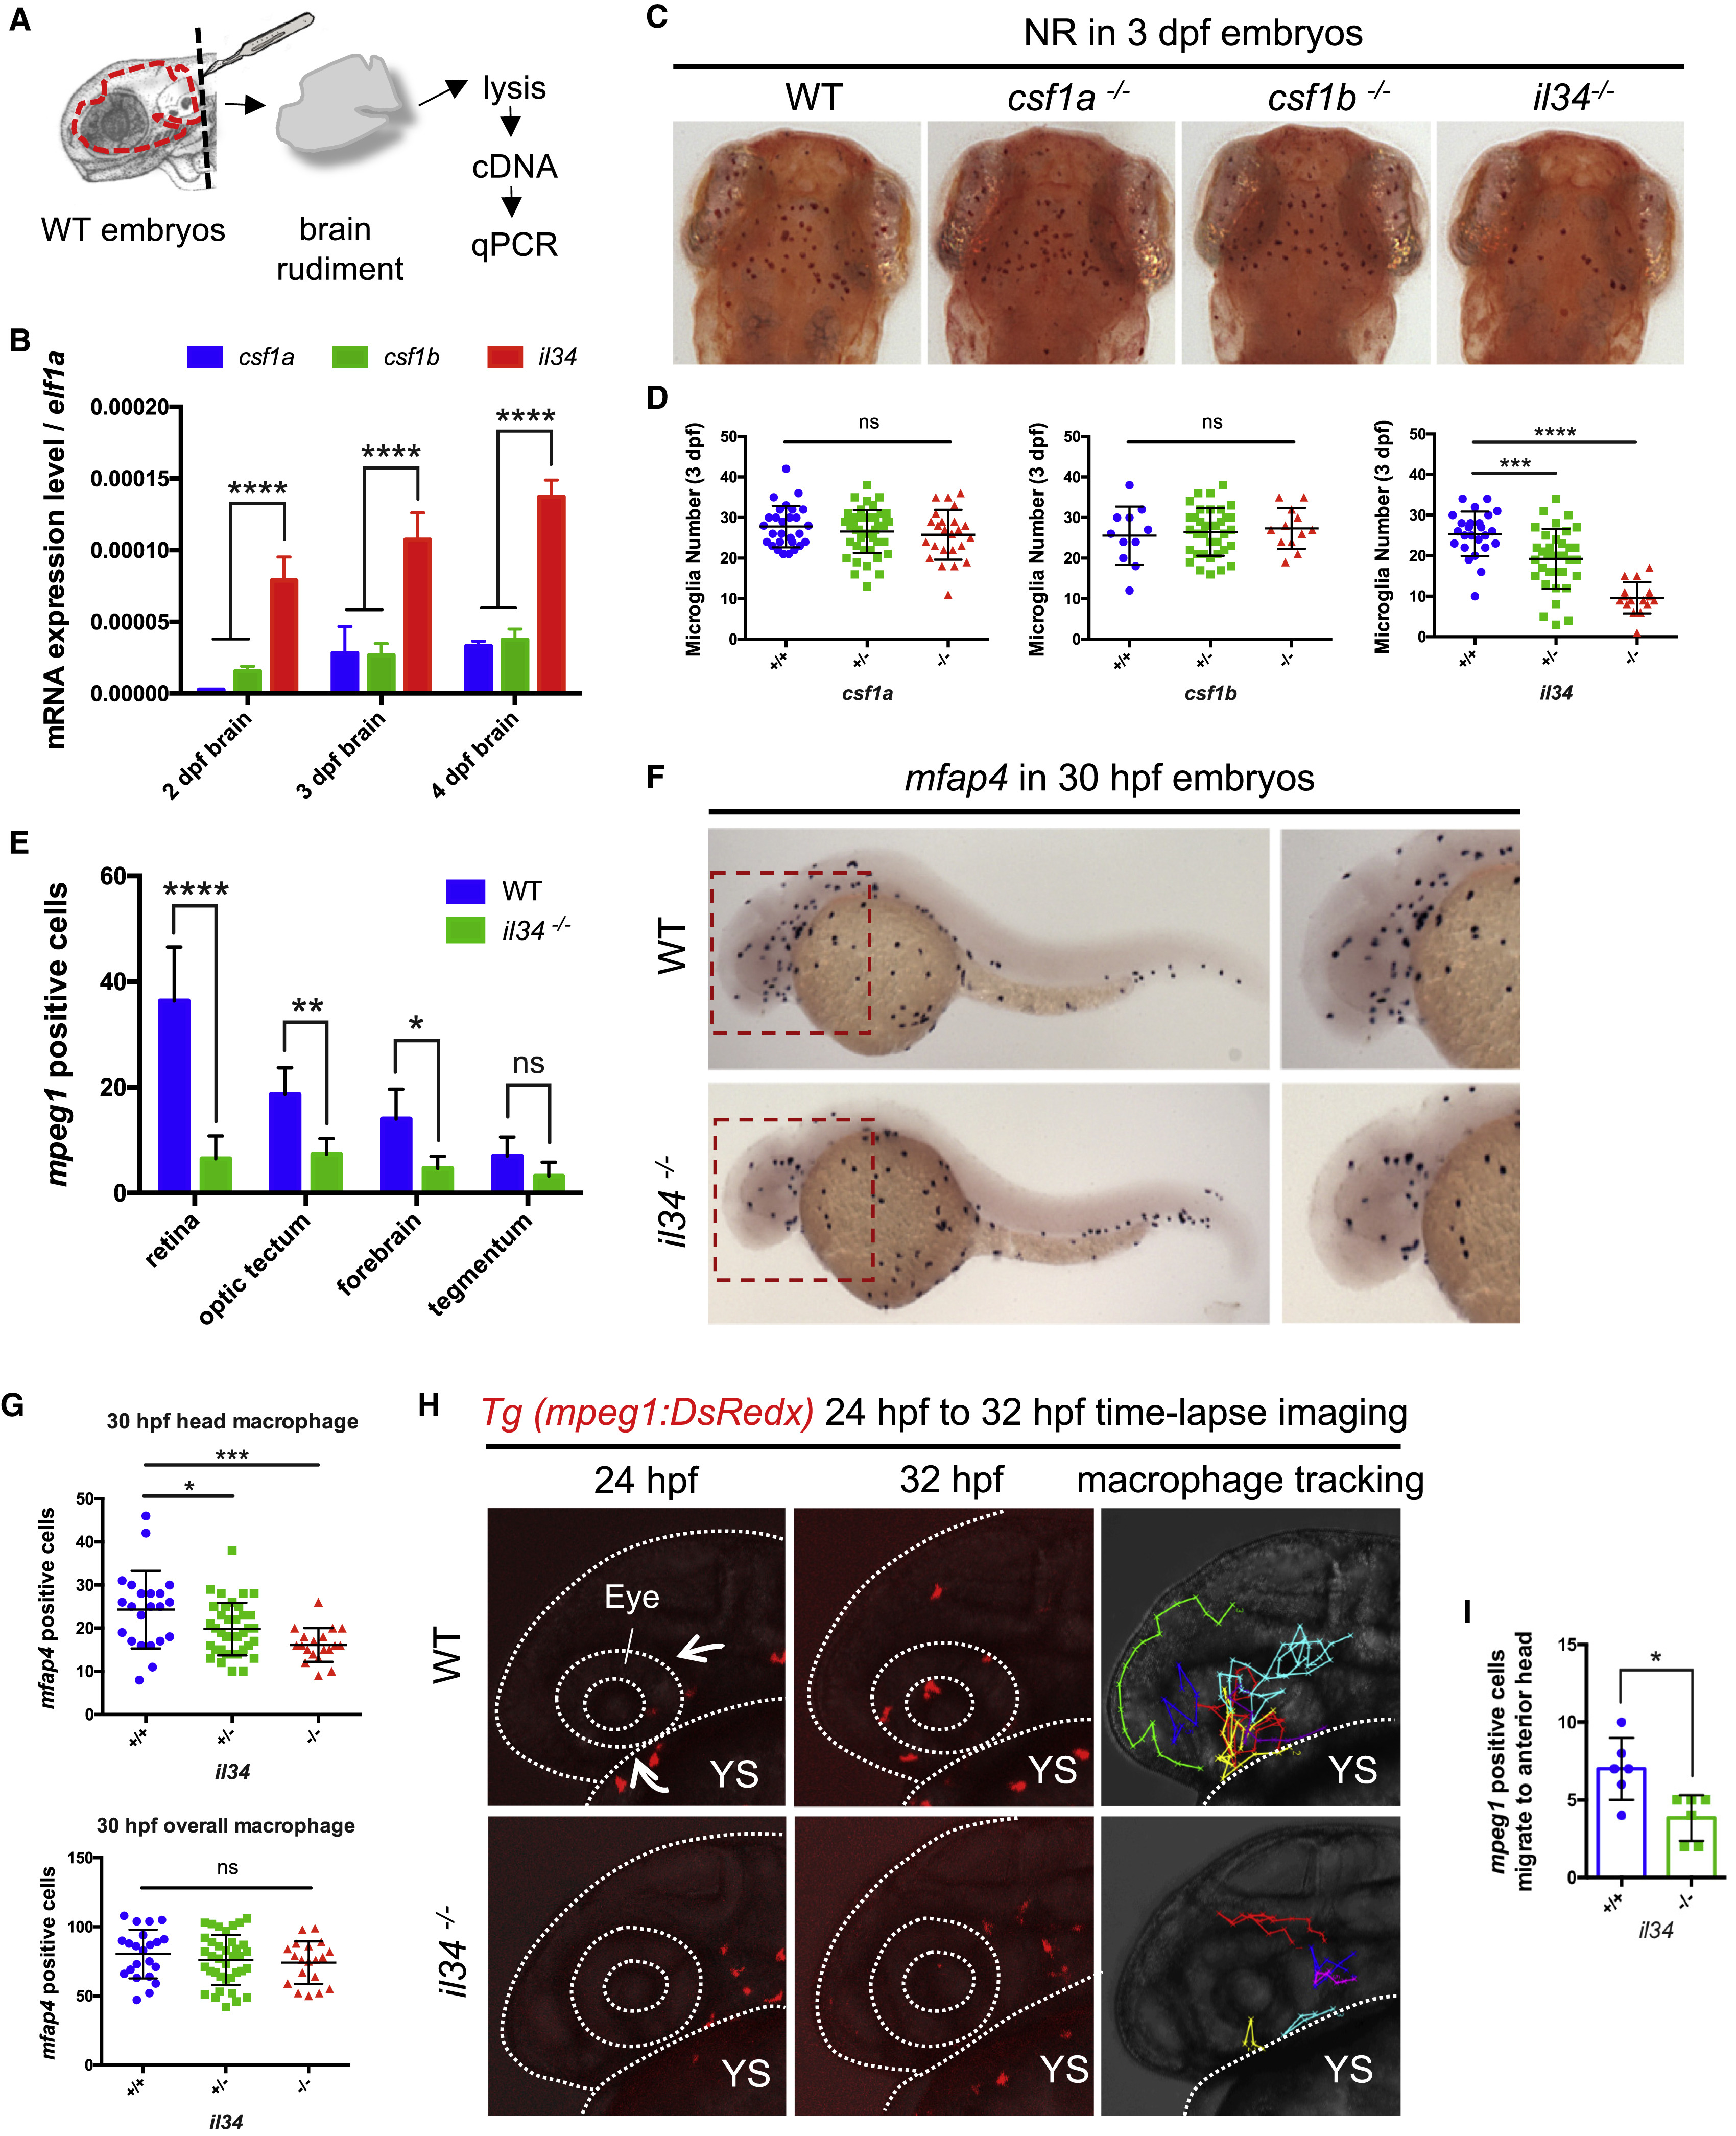
il34 Deficiency Affects the Colonization of Microglial Precursors
(A) Schematic diagram showing the brain rudiment taken from the head of embryos and used for subsequent cDNA library construction.
(B) qRT-PCR of csf1a, csf1b, and il34 expression in the brain rudiments of 2-dpf, 3-dpf, and 4-dpf WT embryos. Pooled data from two or three separate experiments. n = 20 for each single experiment. Values represent means with SD.
(C and D) Neutral red (NR) staining showing microglia in 3-dpf WT, csf1a−/−, csf1b−/−, and il34−/− embryos (C) and quantification (D) of NR+ microglia in the optic tectum of embryos with indicated genotype. n = 28, 47, and 24 for csf1a+/+, csf1a+/−, and csf1a−/− embryos, respectively. n = 11, 36, and 12 for csf1b+/+, csf1b+/−, and csf1b−/− embryos, respectively. n = 25, 35, and 16 for il34+/+, il34+/−, and il34−/− embryos, respectively. Values represent means ± SD.
(E) Quantification of DsRedx+ microglia in different CNS regions of 3-dpf WT Tg(mpeg1:DsRedx) or il34−/−;Tg(mpeg1:DsRedx) embryos. n = 6 for each group. Values represent means with SD. See also Figure S4C.
(F and G) Whole-mount in situ hybridization (WISH) showing mfap4 expression in 30-hpf WT or il34−/− embryos (F) and quantification (G) of mfap4+ macrophages in the head region (upper panel) or the whole embryos (lower panel) with indicated genotype. n = 22, 37, and 19 for il34+/+, il34+/−, and il34−/− embryos, respectively. Values represent means ± SD.
(H) Time-lapse imaging of the head region of WT Tg(mpeg1:DsRedx) and il34−/−;Tg(mpeg1:DsRedx) embryos from 24 hpf to 32 hpf showing the migration of DsRedx+ macrophages to the anterior head regions. Left and middle panels show the beginning (24 hpf) and end (32 hpf) of time-lapse imaging, and right panels show the cell tracking of DsRedx+ macrophages entering the anterior head region. In WT embryos, DsRedx+ macrophages migrate to the anterior head regions from two preferential routes (arrows), while in il34−/− mutants DsRedx+ macrophages rarely reached the anterior head region. The head is indicated by dotted lines. YS, yolk sac. See also Videos S1 and S2.
(I) Quantification of DsRedx+ macrophages migrate to the anterior head regions in the time-lapse imaging of WT Tg(mpeg1:DsRedx) and il34−/−;Tg(mpeg1:DsRedx) embryos from 24 hpf to 32 hpf. n = 6 for each group. Values represent means ± SD. See also S2.
ns, p > 0.05; ∗p ≤ 0.05; ∗∗p ≤ 0.01; ∗∗∗p ≤ 0.001; ∗∗∗∗p ≤ 0.0001.
Reprinted from Developmental Cell, 46, Wu, S., Xue, R., Hassan, S., Nguyen, T.M.L., Wang, T., Pan, H., Xu, J., Liu, Q., Zhang, W., Wen, Z., Il34-Csf1r Pathway Regulates the Migration and Colonization of Microglial Precursors, 552-563.e4, Copyright (2018) with permission from Elsevier. Full text @ Dev. Cell