
Fig. S5
- ID
- ZDB-IMAGE-181004-10
- Publication
- Wu et al., 2018 - Il34-Csf1r Pathway Regulates the Migration and Colonization of Microglial Precursors
- All Figures
- Figures for Wu et al., 2018
|
Fig. S5
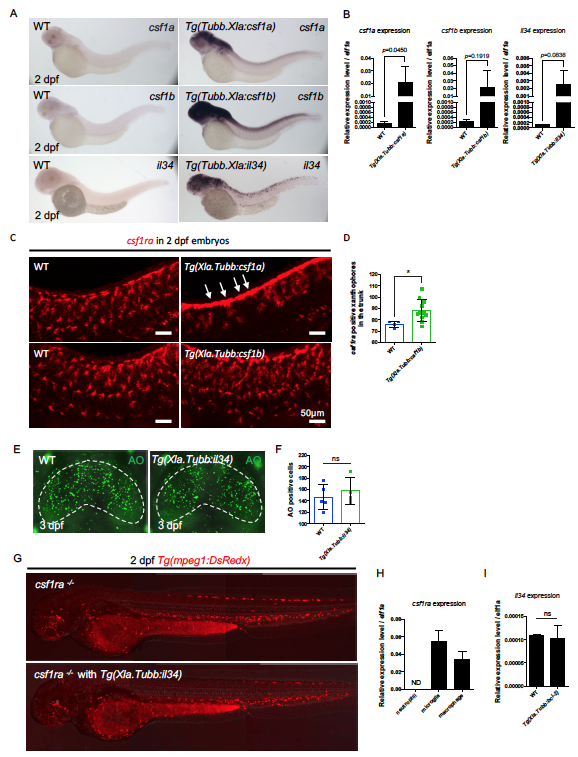
Characterization of Ligand Overexpression Transgenic Embryos. Related to Figure 4 and Figure 5.
(A) WISH showing representative overexpression of csf1a, csf1b and il34 in 2 dpf WT, Tg(Xla.Tubb:csf1a), Tg(Xla.Tubb:csf1b) and Xla.Tubb:il34 injected embryos, respectively. (B) Quantitative RT-PCR of csf1a, csf1b and il34 expression in the respective overexpression embryos at 2 dpf. Pooled from three separate experiments. n = 7 for each single experiment. Values represent means with SD. (C) WISH showing the expression of csf1ra in 2 dpf WT, Tg(Xla.Tubb:csf1a), and Tg(Xla.Tubb:csf1b) embryos. In Tg(Xla.Tubb:csf1a) embryos, there are many csf1ra+ xanthophores stayed in the neural crest region and failed to spread out (arrows). In Tg(Xla.Tubb:csf1b) embryos, there are more csf1ra+ xanthophores in the trunk. (D) Quantification of csf1ra+ xanthophores in the trunk region of 2 dpf WT (n = 4) and csf1b-/- embryos (n = 11). Values represent means ± SD. (E and F) AO staining showing apoptotic neurons (C) and quantification (D) of apoptotic neurons in the optic tectum of 3dpf WT or Tg(Xla.Tubb:il34) embryos injected with pu.1 morpholino. The optic tectum is indicated by dashed lines. n = 5 and 4 for WT and Tg(Xla.Tubb:il34) embryos, respectively. Values represent means with SD. (G) Representative images showing macrophage distribution in 3 dpf csf1ra-/- and csf1ra-/-; Tg(Xla.Tubb:il34) embryos. Macrophages were labeled by Tg(mpeg1:DsRedx) (red). Related to Figure 4G. (H) Quantitative RT-PCR of csf1ra expression in lyz+ neutrophils, mpeg1+ microglia and mpeg1+ peripheral macrophages from 3 dpf Tg(lyz:GFP) or Tg(mpeg1:DsRedx) embryos. Pooled from two separate experiments. n = 5 for each group in a single experiment. Values represent means with SD. (I) Quantitative RT-PCR of il34 expression in the brain rudiments of 3 dpf WT or Tg(Xla.Tubb:bcl-2) embryos. Pooled from three separate experiments. n = 20 for each single experiment. Values represent means with SD. ns, P>0.05; *, P ≤ 0.05
Reprinted from Developmental Cell, 46, Wu, S., Xue, R., Hassan, S., Nguyen, T.M.L., Wang, T., Pan, H., Xu, J., Liu, Q., Zhang, W., Wen, Z., Il34-Csf1r Pathway Regulates the Migration and Colonization of Microglial Precursors, 552-563.e4, Copyright (2018) with permission from Elsevier. Full text @ Dev. Cell