
Image
|
Figure Caption
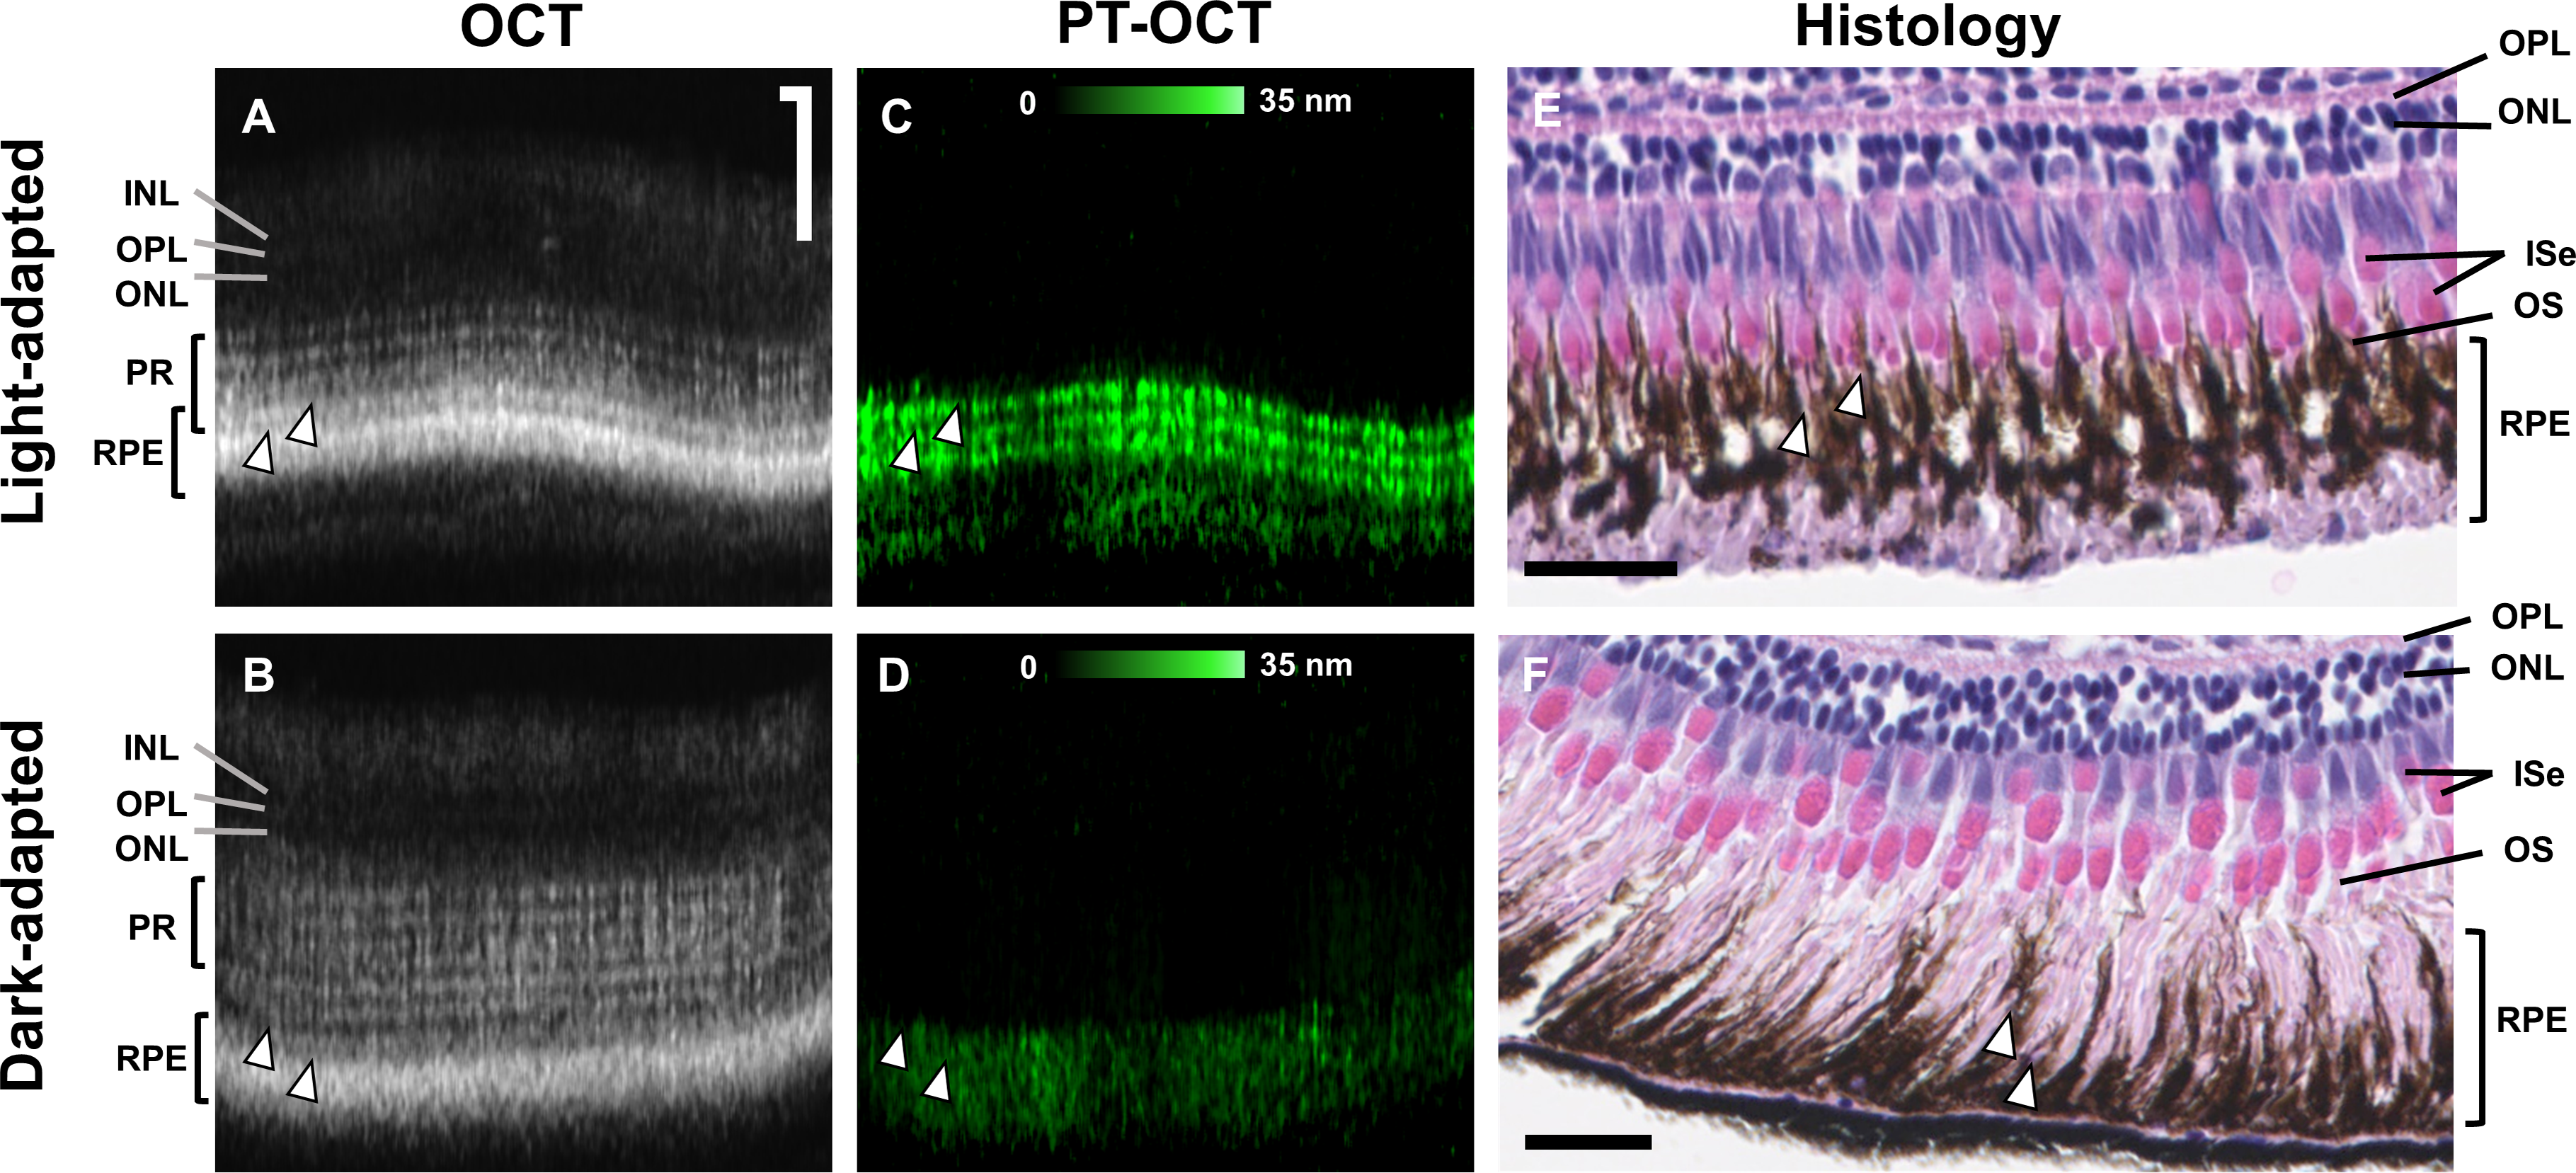
Fig. 5
Melanosome migration observed in histology sections. (A, B) OCT and (C, D) corresponding PT-OCT B-scans with (E, F) corresponding H&E histology sections from the same animal for both light-adapted (A, C, E) and dark-adapted (B, D, F) zebrafish. White arrowheads indicate different structures where melanin is present (coregistered between images A and C, and B and D, approximate location for images E and F). Scale bar: 50 μm for OCT and PT-OCT images, 25 μm for histology. INL, inner nuclear layer; ISe, photoreceptor inner segment ellipsoid zone; OS, photoreceptor outer segment.
Acknowledgments
This image is the copyrighted work of the attributed author or publisher, and
ZFIN has permission only to display this image to its users.
Additional permissions should be obtained from the applicable author or publisher of the image.
Full text @ Transl Vis Sci Technol