
Fig. 2
- ID
- ZDB-IMAGE-181003-14
- Publication
- Yakulov et al., 2018 - CXCL12 and MYC control energy metabolism to support adaptive responses after kidney injury
- All Figures
- Figures for Yakulov et al., 2018
|
Fig. 2
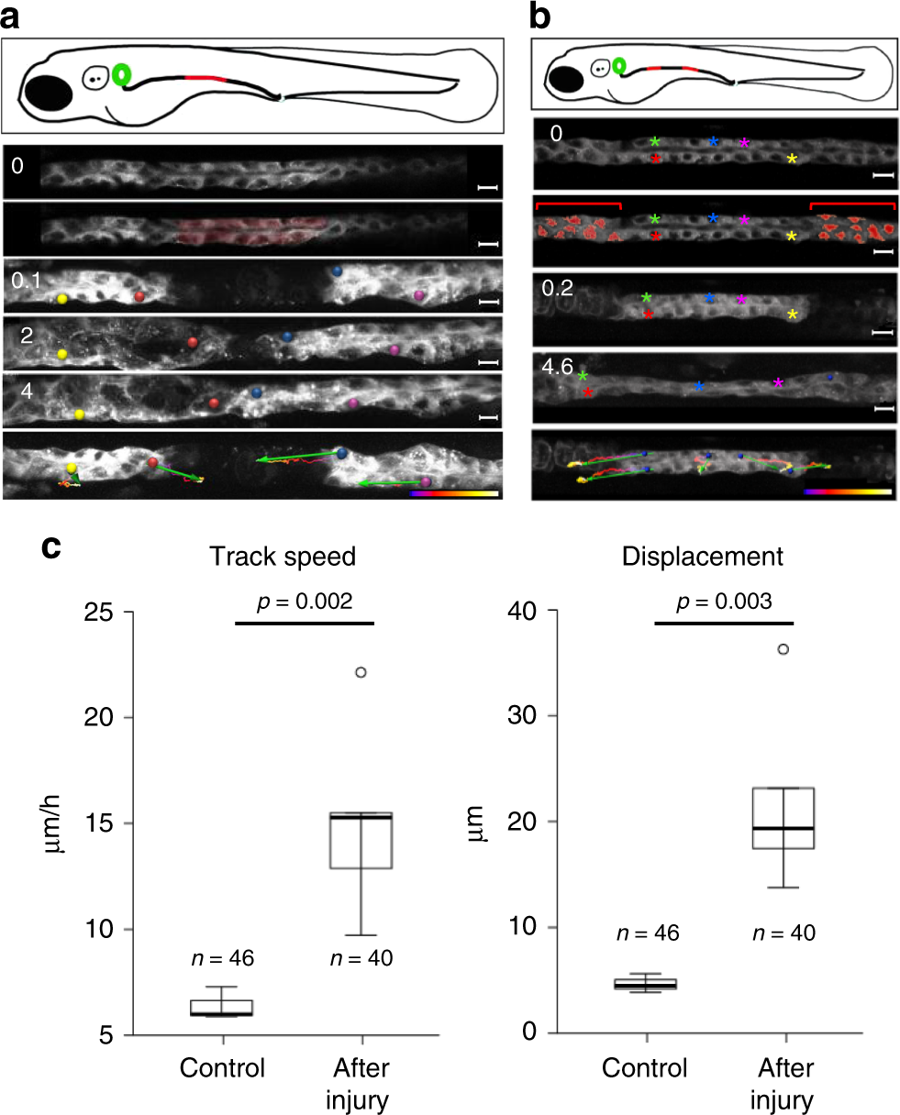
Pronephric duct injuries are repaired by migration. a Frames from Supplementary Movie 1, showing recovery after ablation of a pronephric duct fragment (ablated cells are marked in red). The free ends of the duct move towards each other, whereby the leading cells extend protrusions and exhibit active cell migration. The bottom panel depicts tracking of individual cells over time. Tracking lines are color coded, ranging from blue to white (0–9 h); the green arrows summarize migration direction and cell displacement (scale bars, 10 µm). b Frames from Supplementary Movie 2. The panel depicts a two-sided cell ablation (red-labeled cells), isolating a patch of pronephric cells. The free ends of the isolated duct migrated in opposite direction, stretching the isolated segment. Whereas the cells in the terminal regions exhibited prominent net displacement, the cells in the middle segment remained almost stationary. Tracking lines are color coded, ranging from blue to white (0–9 h) (scale bars, 10 µm). c To compare repair response and collective cell migration, 2-day-old Tg(-8.0cldnb:LY-EGFP), TgBAC(cxcr4b:h2b-RFP) transgenic zebrafish embryos were mounted on the side to image pronephric ducts by confocal microscopy. The pronephros was injured with a two-photon laser at 36 h, and track speed (left panel) (p = 0.0023, t-test) and track displacement length (right panel) (p = 0.0034, t-test) was measured over 2 h. After injury, tubular epithelial cells adjacent to the injury almost tripled their speed. The cell number (n) was derived from three control and six injured pronephric tubules