
Image
|
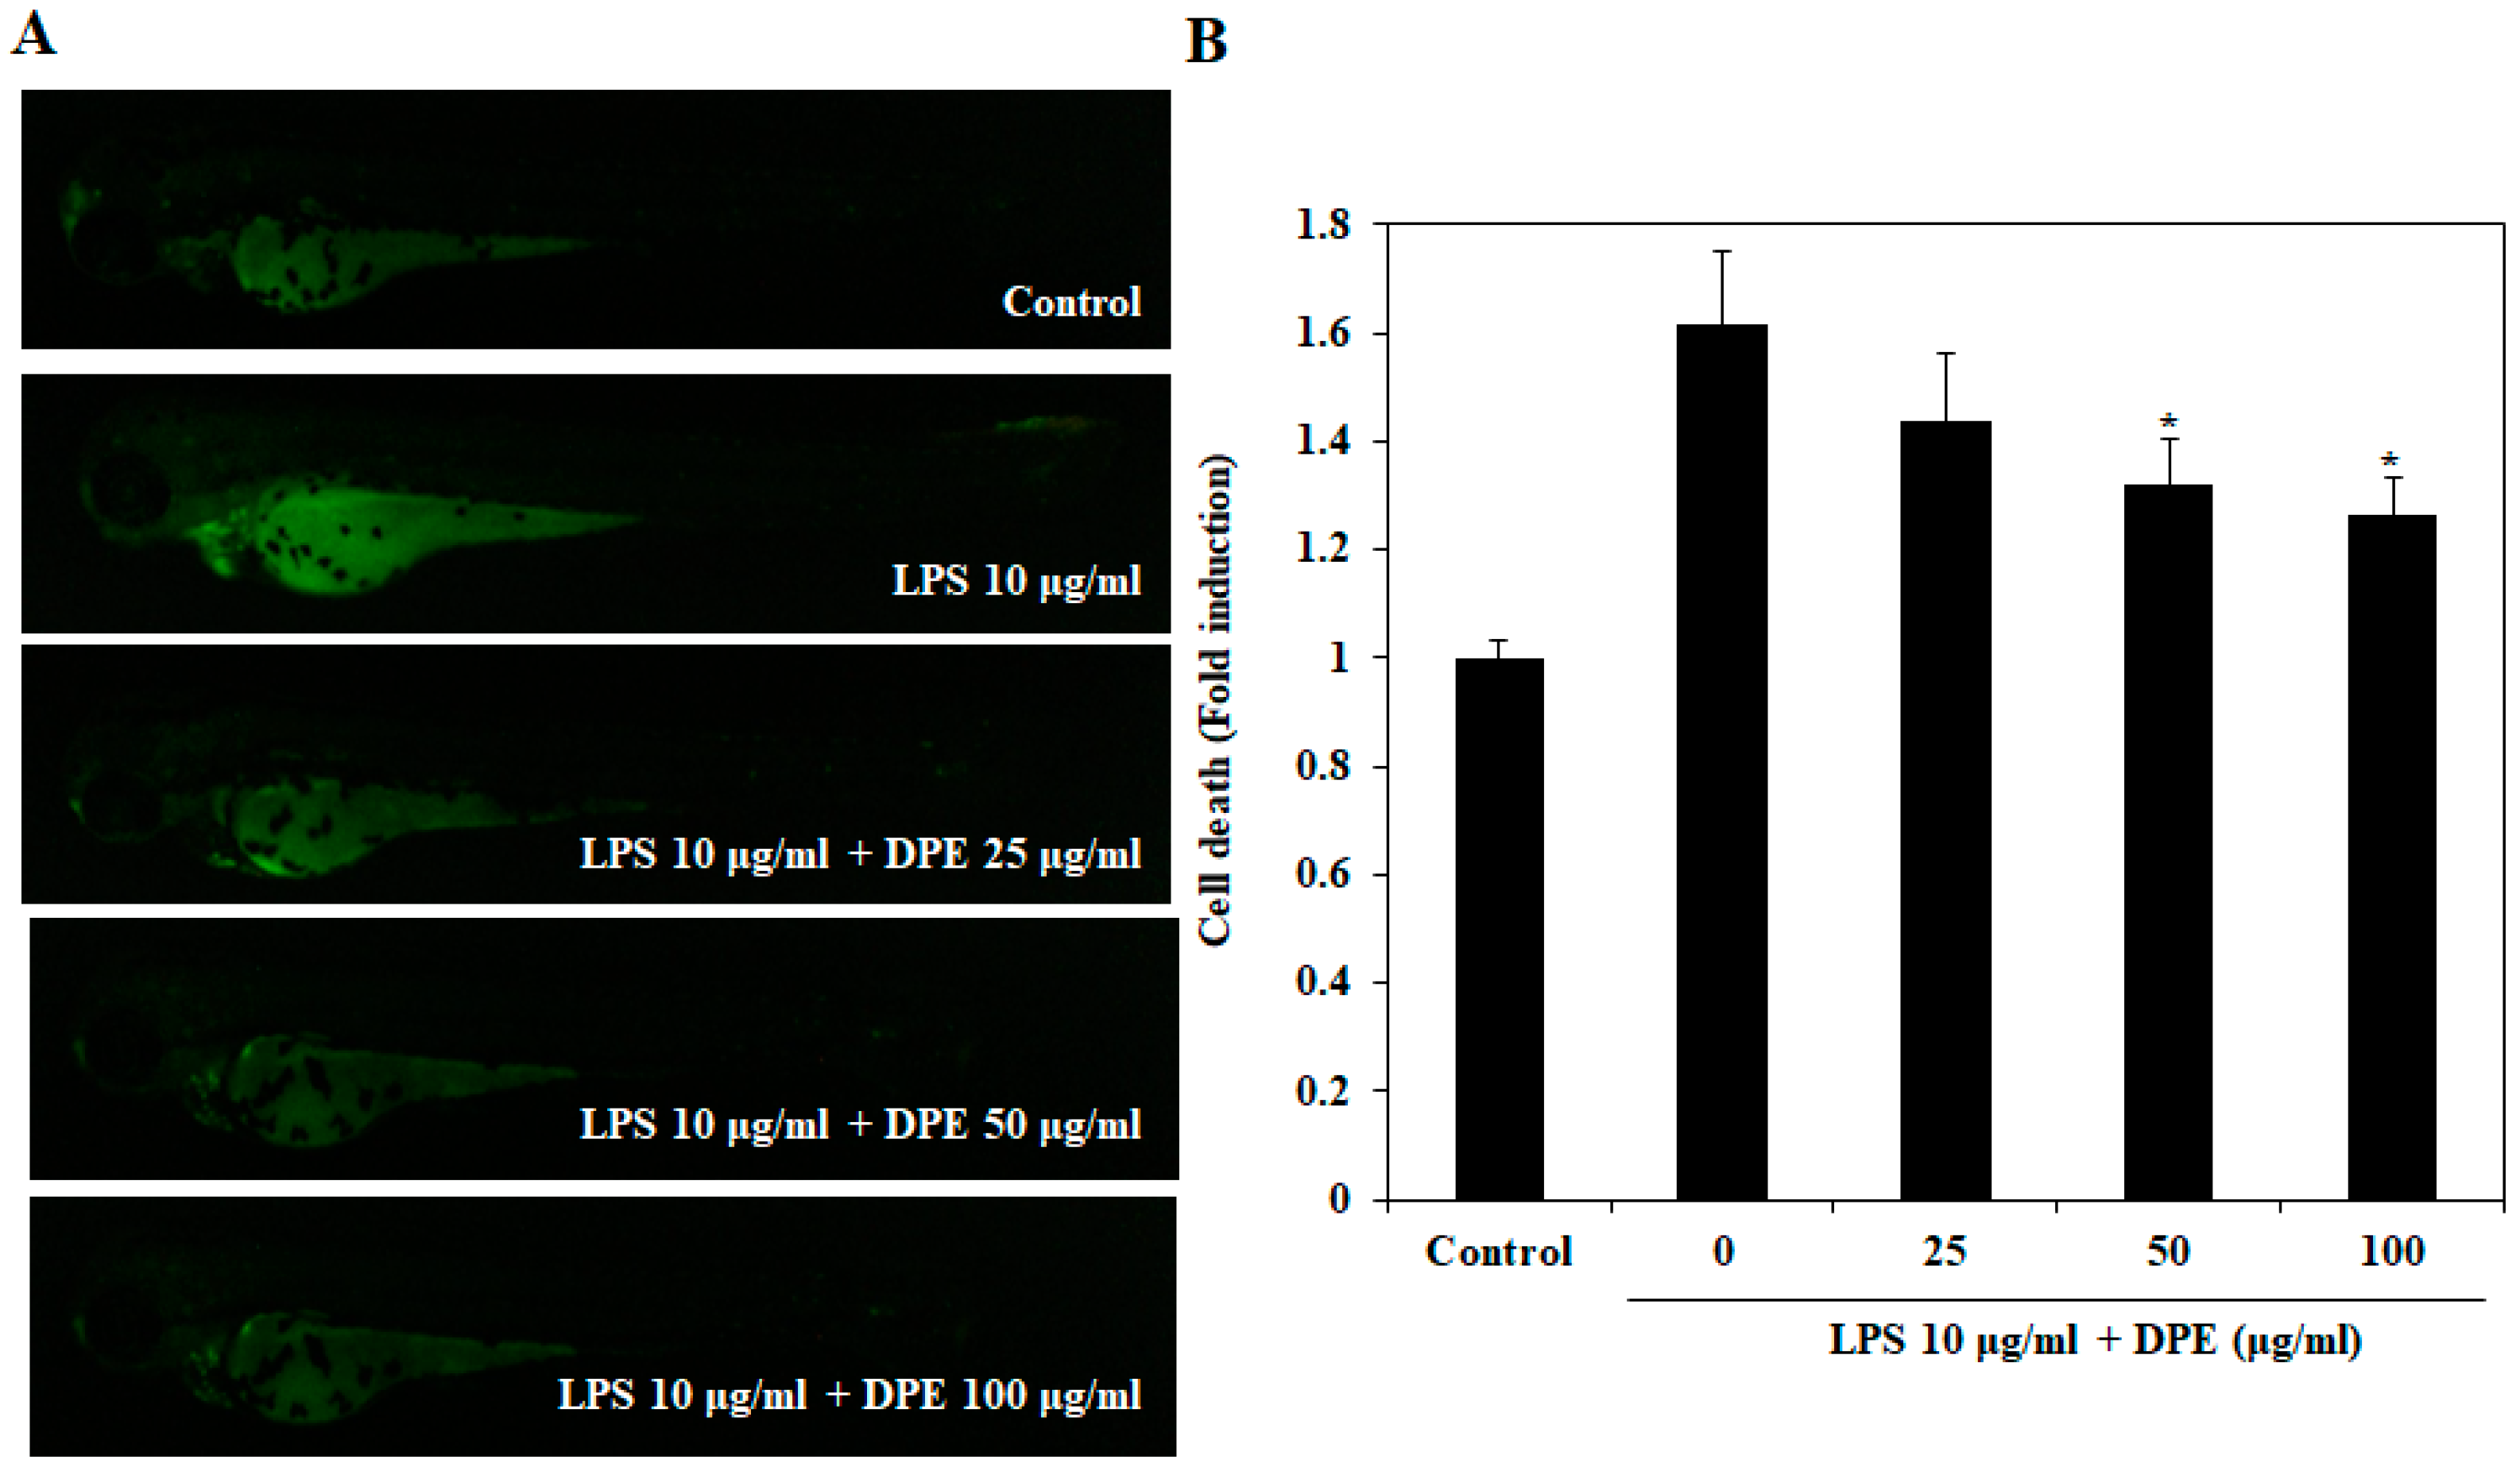
Figure Caption
Fig. 5
Protective effect of DPE on LPS-stimulated cell death in zebrafish embryos. (A) The cell death levels were measured after staining with acridine orange by image analysis and fluorescence microscopy. (B) Individual zebrafish fluorescence intensity was quantified using an image J program. The values are expressed as the mean ± SE. Significant differences from the only LPS-treated group were identified at * p < 0.05.
Acknowledgments
This image is the copyrighted work of the attributed author or publisher, and
ZFIN has permission only to display this image to its users.
Additional permissions should be obtained from the applicable author or publisher of the image.
Full text @ Int. J. Mol. Sci.