
Fig. S1
- ID
- ZDB-IMAGE-180928-4
- Publication
- Tiefenbach et al., 2018 - Idebenone and coenzyme Q10 are novel PPARα/γ ligands, with potential for treatment of fatty liver diseases.
- All Figures
- Figures for Tiefenbach et al., 2018
|
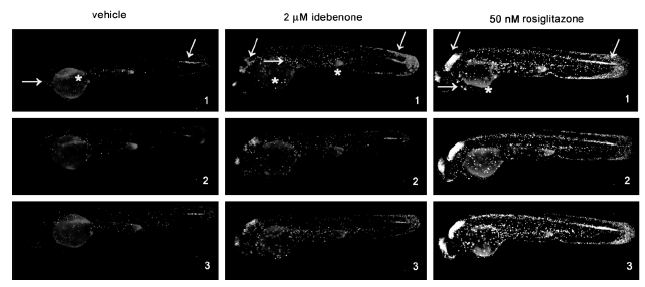
Fig. S1
Variability of GFP responses in PPAR ligand trap embryos.
GFP responses in 2 dpf heterozygous PPARγ embryos are shown. Panels on the left show responses to endogenous ligand and cofactors in 3 different embryos. Signals are seen in the tail bud, as well as in the posterior spinal cord and skin, GFP (indicated by arrows). PPARγ embryos treated with idebenone (center panels), or rosiglitazone (right panels) show increased GFP expression in the tail bud and posterior spine as well as additional expression in the CNS and eye (indicated by arrows). Auto-fluorescence in the yolk is indicated by asterisks. Rosiglitazone treatment also elicited GFP expression in the heart (right panel upper image, indicated by arrow). Views are lateral with anterior to the left (avg n=10, replicated 20 times).