
Fig. 2
- ID
- ZDB-IMAGE-180928-2
- Genes
- Publication
- Tiefenbach et al., 2018 - Idebenone and coenzyme Q10 are novel PPARα/γ ligands, with potential for treatment of fatty liver diseases.
- All Figures
- Figures for Tiefenbach et al., 2018
|
Fig. 2
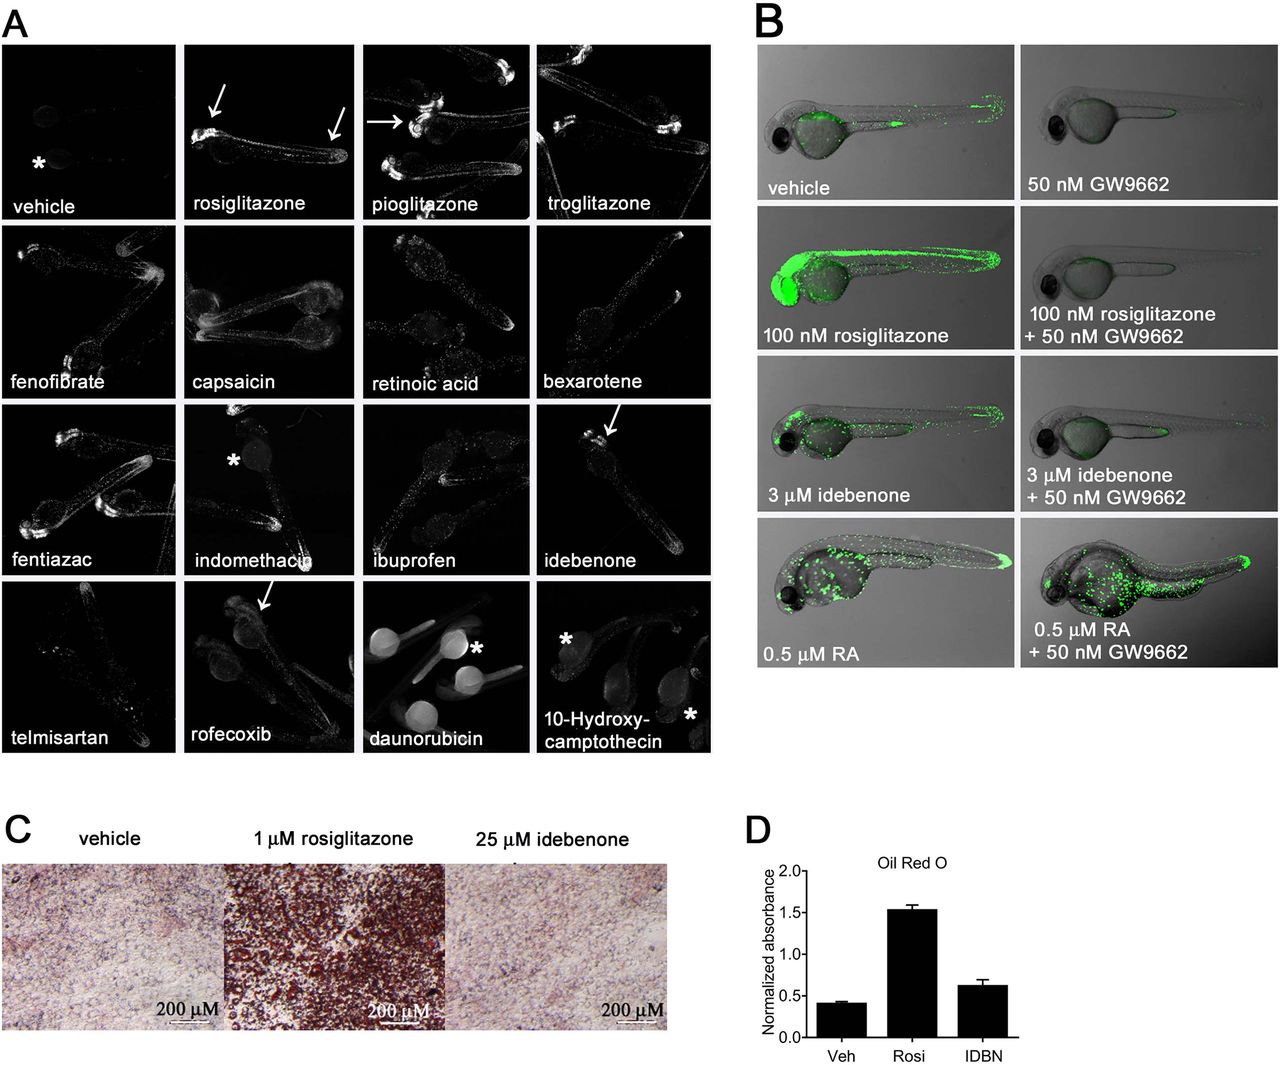
Analysis of hits. (A) Pictures of laser-scanning cytometer-imaged hits in 2 dpf embryos. 1% DMSO was used as vehicle and 50 nM rosiglitazone as positive control. At 1 µM screening concentration, 12 hits were identified. Images show close ups from re-screens at 10 µM concentrations. Idebenone and false positives (last two images) were treated with 3 µM concentrations due to lethality at 10 µM (mean n=5, replicated two times). Arrows indicate sites of GFP expression. Asterisks indicate nonspecific background. (B) At the stage shown (2 dpf), vehicle-treated LT-PPARγ transgenic embryos show weak responses to endogenous ligands and cofactors and strong responses in the presence of the receptor-specific full agonist rosiglitazone in the CNS, heart, blood, renal tube and eye. Idebenone treatment leads to relatively lower and more restricted GFP expression in cells of the blood, epidermis and CNS. 9-cis-retinoic acid (RA) increases GFP expression in keratinocytes, in the tail bud and in epidermis, presumably through activation of the zebrafish RXR receptor. The GW9662 suicide antagonist blocks agonist activity of rosiglitazone and idebenone, but not of RA. Overlay pictures of bright-field and GFP (85% transparent) from 2 dpf embryos are shown. Views are lateral with anterior to the left (mean n=10, replicated two times). (C) The treatment of murine 3T3-L1 pre-adipocytes with rosiglitazone in the presence of dexamethasone, isobutylmethylxanthine and insulin results in the accumulation of intracellular lipids. In contrast, cells treated with vehicle (DMSO) or idebenone (IDBN) instead of rosiglitazone showed no accumulation of lipid (Oil-Red-O staining). Images were taken at 100× magnification with a Leica M205 FA microscope. (D) Oil-Red-O staining quantification from cells shown in C. Oil-Red-O dye was eluted using isopropanol and absorbance was measured at 505 nm. Data represent mean±s.d., n=3.