
Fig. S2
- ID
- ZDB-IMAGE-180921-18
- Publication
- Tabor et al., 2018 - Presynaptic Inhibition Selectively Gates Auditory Transmission to the Brainstem Startle Circuit
- All Figures
- Figures for Tabor et al., 2018
|
Fig. S2
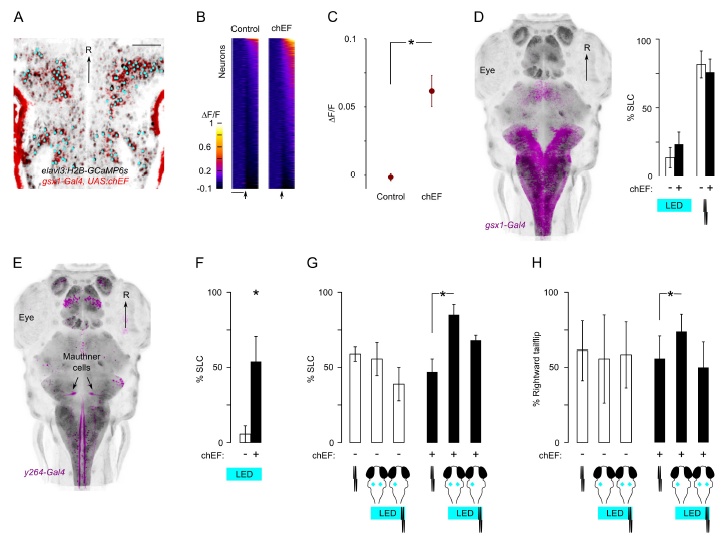
Optogenetic excitation of Gsx1 neurons and startle command Mauthner cells. Related to Figure 3
A. 2-photon image of chEF-expressing Gsx1 cells (red) and pan-neuronal GCaMP6s signal (black) in the hindbrain of a gsx1-Gal4, UAS:chEF-RFP, elavl3:H2B-GCaMP6s larva. Manually identified neurons (cyan markers) used to analyze optogenetically-evoked calcium signals. Rostral (R). Scale bar 50 μm.
B. Normalized GCamP6s fluorescence change (ΔF/F, color scale), for control neurons (left, 431 neurons, 2 elavl3:H2B-GCaMP6s larvae) and chEF-expressing Gsx1 neurons (right, 634 neurons, 3 gsx1-Gal4, UAS:chEF-RFP, elavl3:H2B-GCaMP6s larvae). Neurons are sorted by ΔF/F immediately after LED illumination of the hindbrain. Arrows indicate time of LED stimuli. Scale bar 1 s.
C. Mean (±s.e.m) calcium signal immediately after LED illumination for chEF-expressing Gsx1 neurons (chEF) and neurons without chEF (Control). n=3 chEF-expressing larvae and n=2 control larvae. WRS test, * P=0.02. Note, that when analyzed using the same criteria as for Figure 2 to identify active neurons, 8±4% of gsx1 neurons without chEF responded on at least one trial, and their mean response frequency was 33 ± 4% (i.e. most responded on only a single trial), whereas 36 ± 2% neurons expressing chEF responded at least once, with a response frequency of 49 ± 2%. So a small number of Gsx1 neurons are activated by the light flash, but the fraction and response rate is greatly increased after expression of chEF.
D. Horizontal projection of gsx1-Gal4 labeled Gsx1 cells (pink). Tail-flips (% SLC) during LED illumination of the hindbrain (left), and to an acoustic pulse (right) in larvae with Gsx1 cells with chEF (gsx1-Gal4, UAS:chEF-RFP, black), and clutchmates lacking chEF (white). WRS test; LED illumination: P=0.5, n=7 chEF-expressing larvae, n=3 controls; acoustic pulse: P=0.99, n=7 chEF-expressing larvae, n=3 controls.
E. Horizontal projection of y264-Gal4 (pink).
F. Short-latency tail-flips (% SLC) during LED illumination of the hindbrain, in larvae with Mauthner cells with chEF (y264-Gal4, UAS:chEF-RFP, black), and clutchmates lacking chEF (white). n=4 chEF-expressing larvae, n=3 controls. WSR test against 0, *P<0.05.
G. SLC to an acoustic pulse, and during bilateral (two cyan squares), or unilateral (one cyan square) LED illumination immediately before and during an acoustic pulse, in larvae with Mauthner cells with chEF (black), and clutchmates lacking chEF (white). n=4 chEF-expressing larvae, n=3 controls. Paired t-test, *P<0.05. All error bars are s.e.m.
H. Rightward tail-flips to an acoustic pulse, and during LED illumination of the left Mauthner cell, or both Mauthner cells before and during an acoustic pulse, in larvae with Mauthner cells with chEF (black) and clutchmates lacking chEF (white). n=4 chEF-expressing larvae, n=3 controls. Paired t-test, *P<0.05.