
Fig. 4
- ID
- ZDB-IMAGE-180921-14
- Publication
- Tabor et al., 2018 - Presynaptic Inhibition Selectively Gates Auditory Transmission to the Brainstem Startle Circuit
- All Figures
- Figures for Tabor et al., 2018
|
Fig. 4
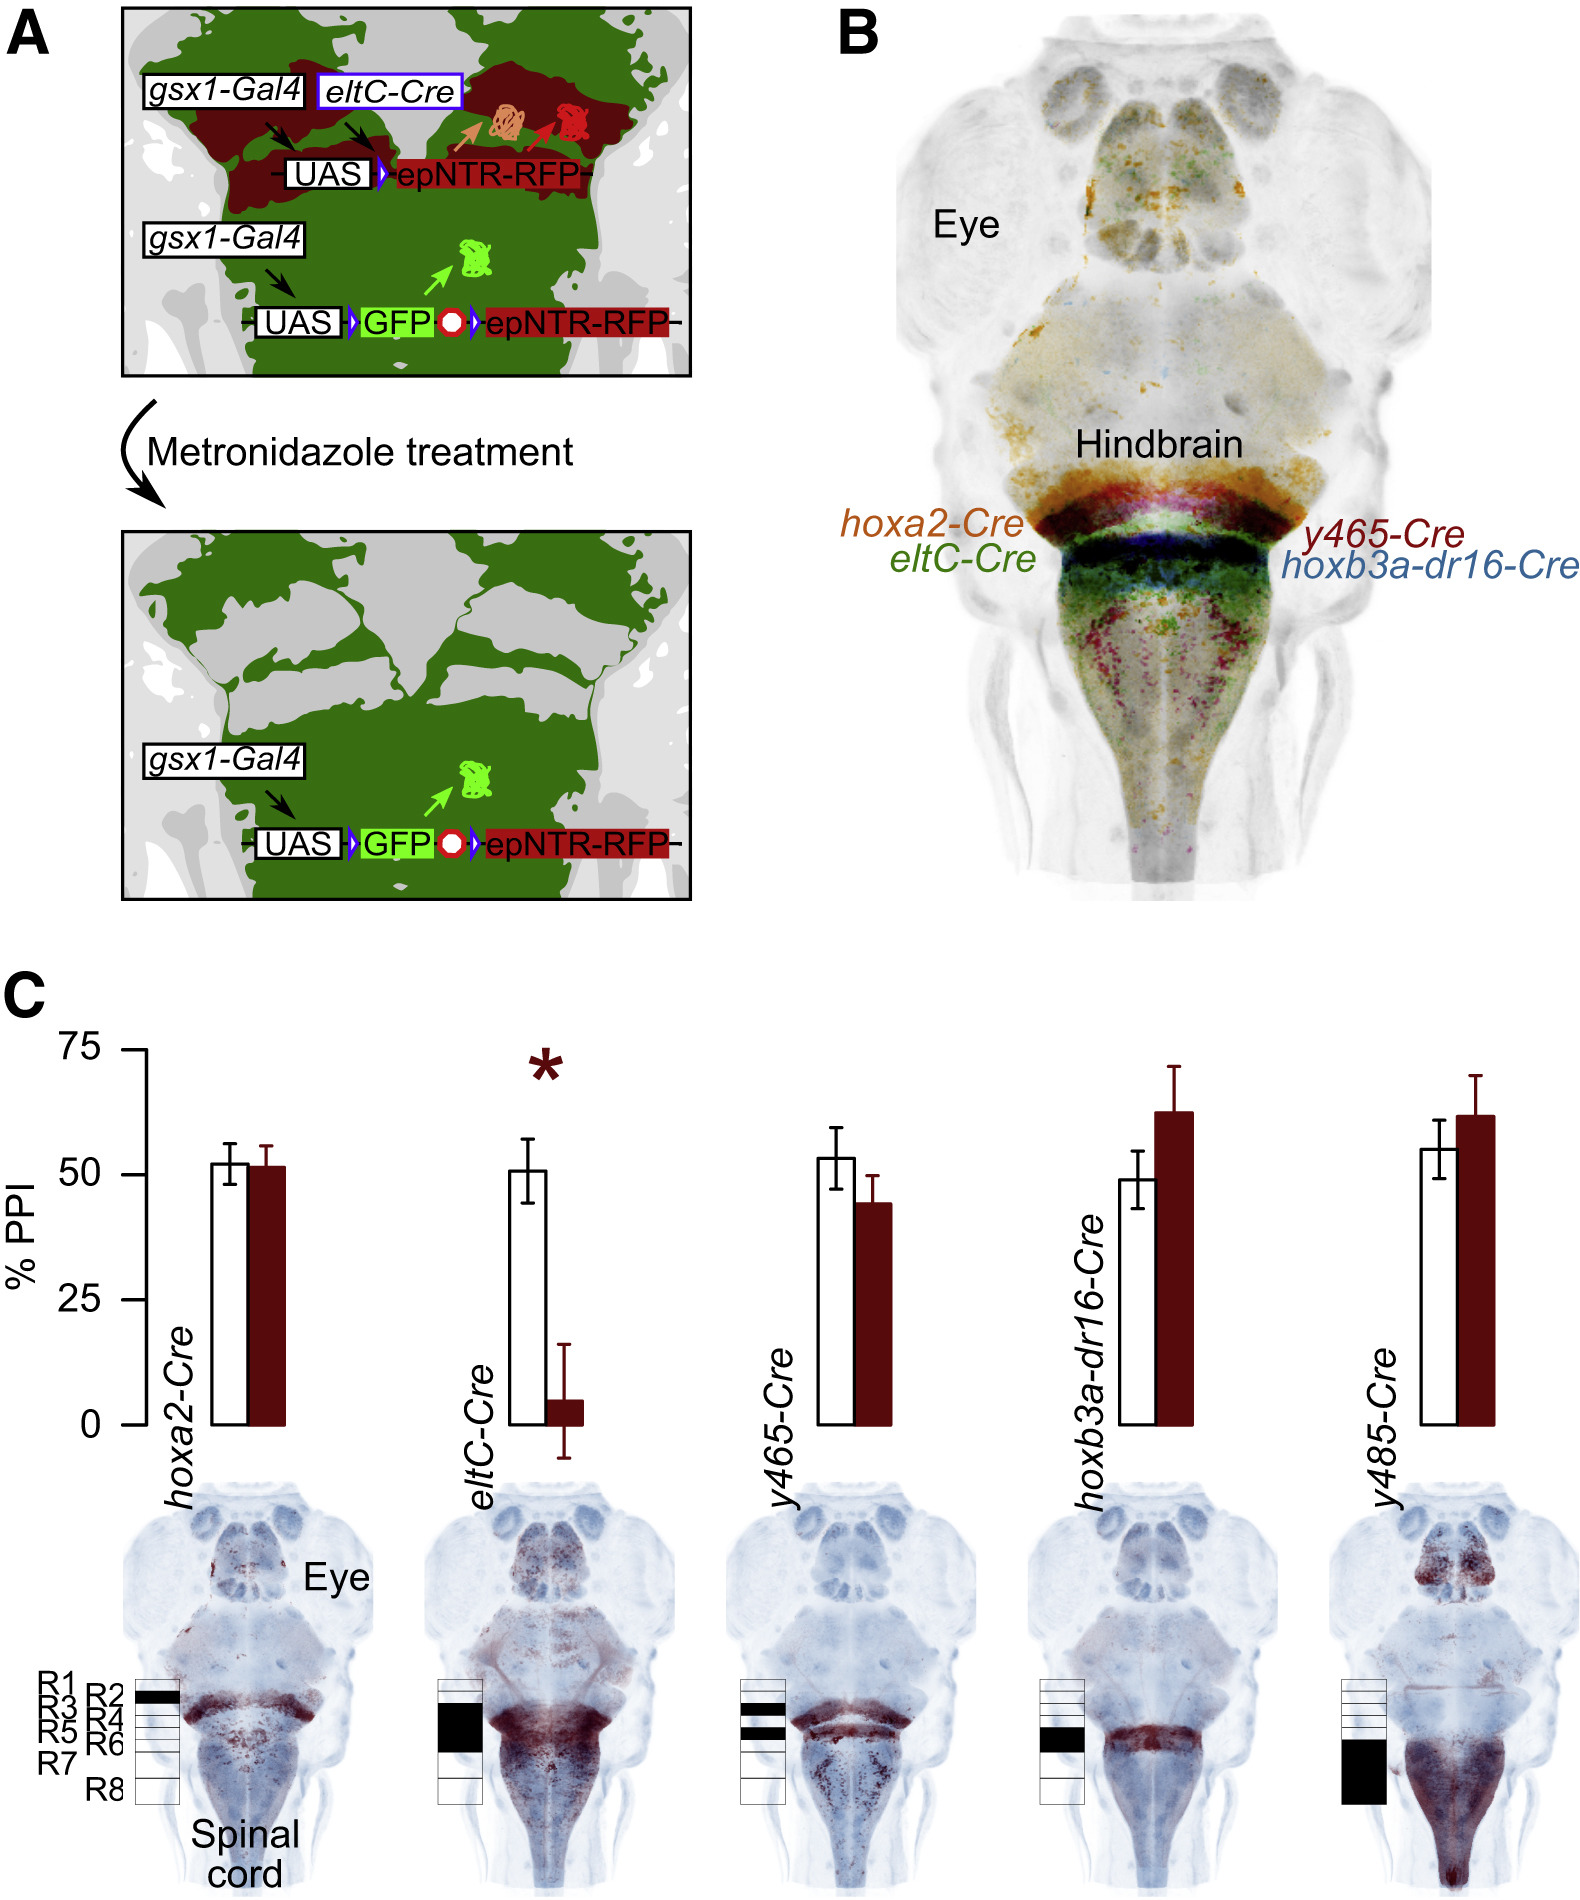
Intersectional Ablation of Candidate PPI Neurons
(A) Schematic of KillSwitch method: Nitroreductase (epNTR, orange) and RFP expressed in cells with Gal4 and Cre activity (red), while cells with only Gal4 activity express GFP (green). After metronidazole treatment, epNTR-dependent ablation eliminates Gal4+, Cre+ cells.
(B) Projection of Cre lines with differential expression in hindbrain rhombomeres.
(C) Prepulse inhibition in larvae with rhombomere-specific ablation of Gsx1 neurons (red), or metronidazole-treated clutchmates without nitroreductase expression (white). Projections show the full pattern of Cre expression. Schematic indicates rhombomere coverage by each line. Wilcoxon rank-sum (WRS) test, number of fish (control, ablated): hoxa2-Cre p = 0.99 (53, 70), eltC-Cre p = 0.003 (33, 10), y465-Cre p = 0.3 (30, 28), hoxb3a-dr16-Cre p = 0.1 (33, 17), y485-Cre p = 0.5 (21, 11). Error bars are SEM. ∗p < 0.05.
See also Figure S3 and Table S2.