
|
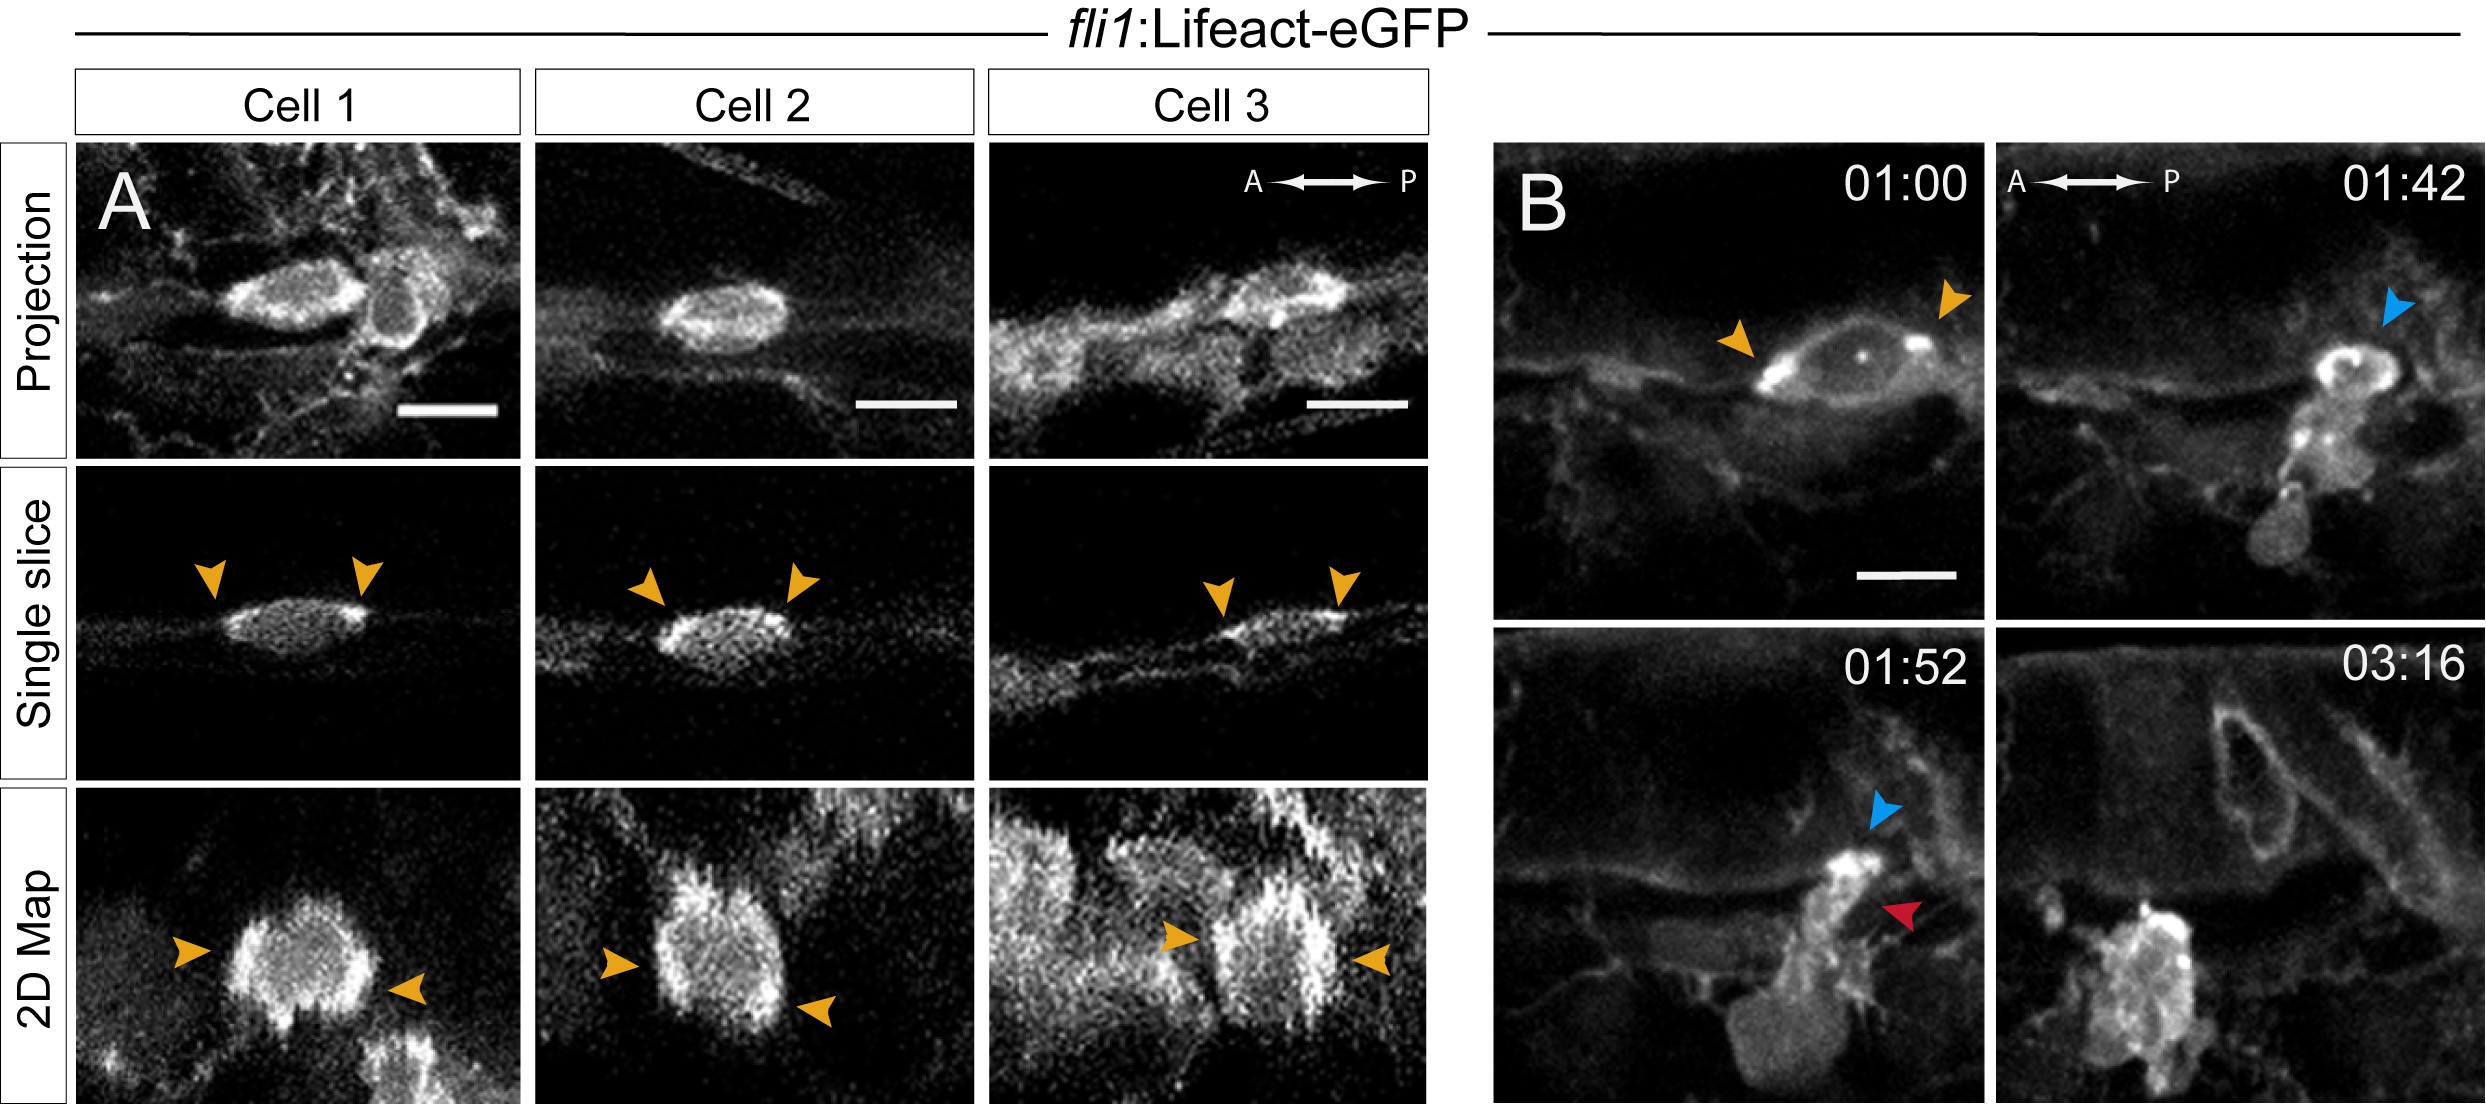
Fig. 5
Actin localization and dynamics.
(A–B) Lifeact-eGFP expressing 48 hpf embryos were imaged by spinning-disk confocal microscopy to obtain maximum projections of Z-planes (A, top and B), single Z planes (A, middle), or 2D-map projections (A, bottom; note that cells #2 and #3 are from the same aorta; see also Figure 5—source data 1). Yellow arrowheads: spots enriched with F-actin and aligned with the antero-posterior axis. (B) Images extracted from Figure 5—video 1. F-actin is enriched at the level of the contracting circumferential belt (top left) that converts into a ring (top right, blue arrowhead), and subsequently in the foot (red arrowhead). Time is indicated in hr:min. Scale bars, 10 μm.