
|
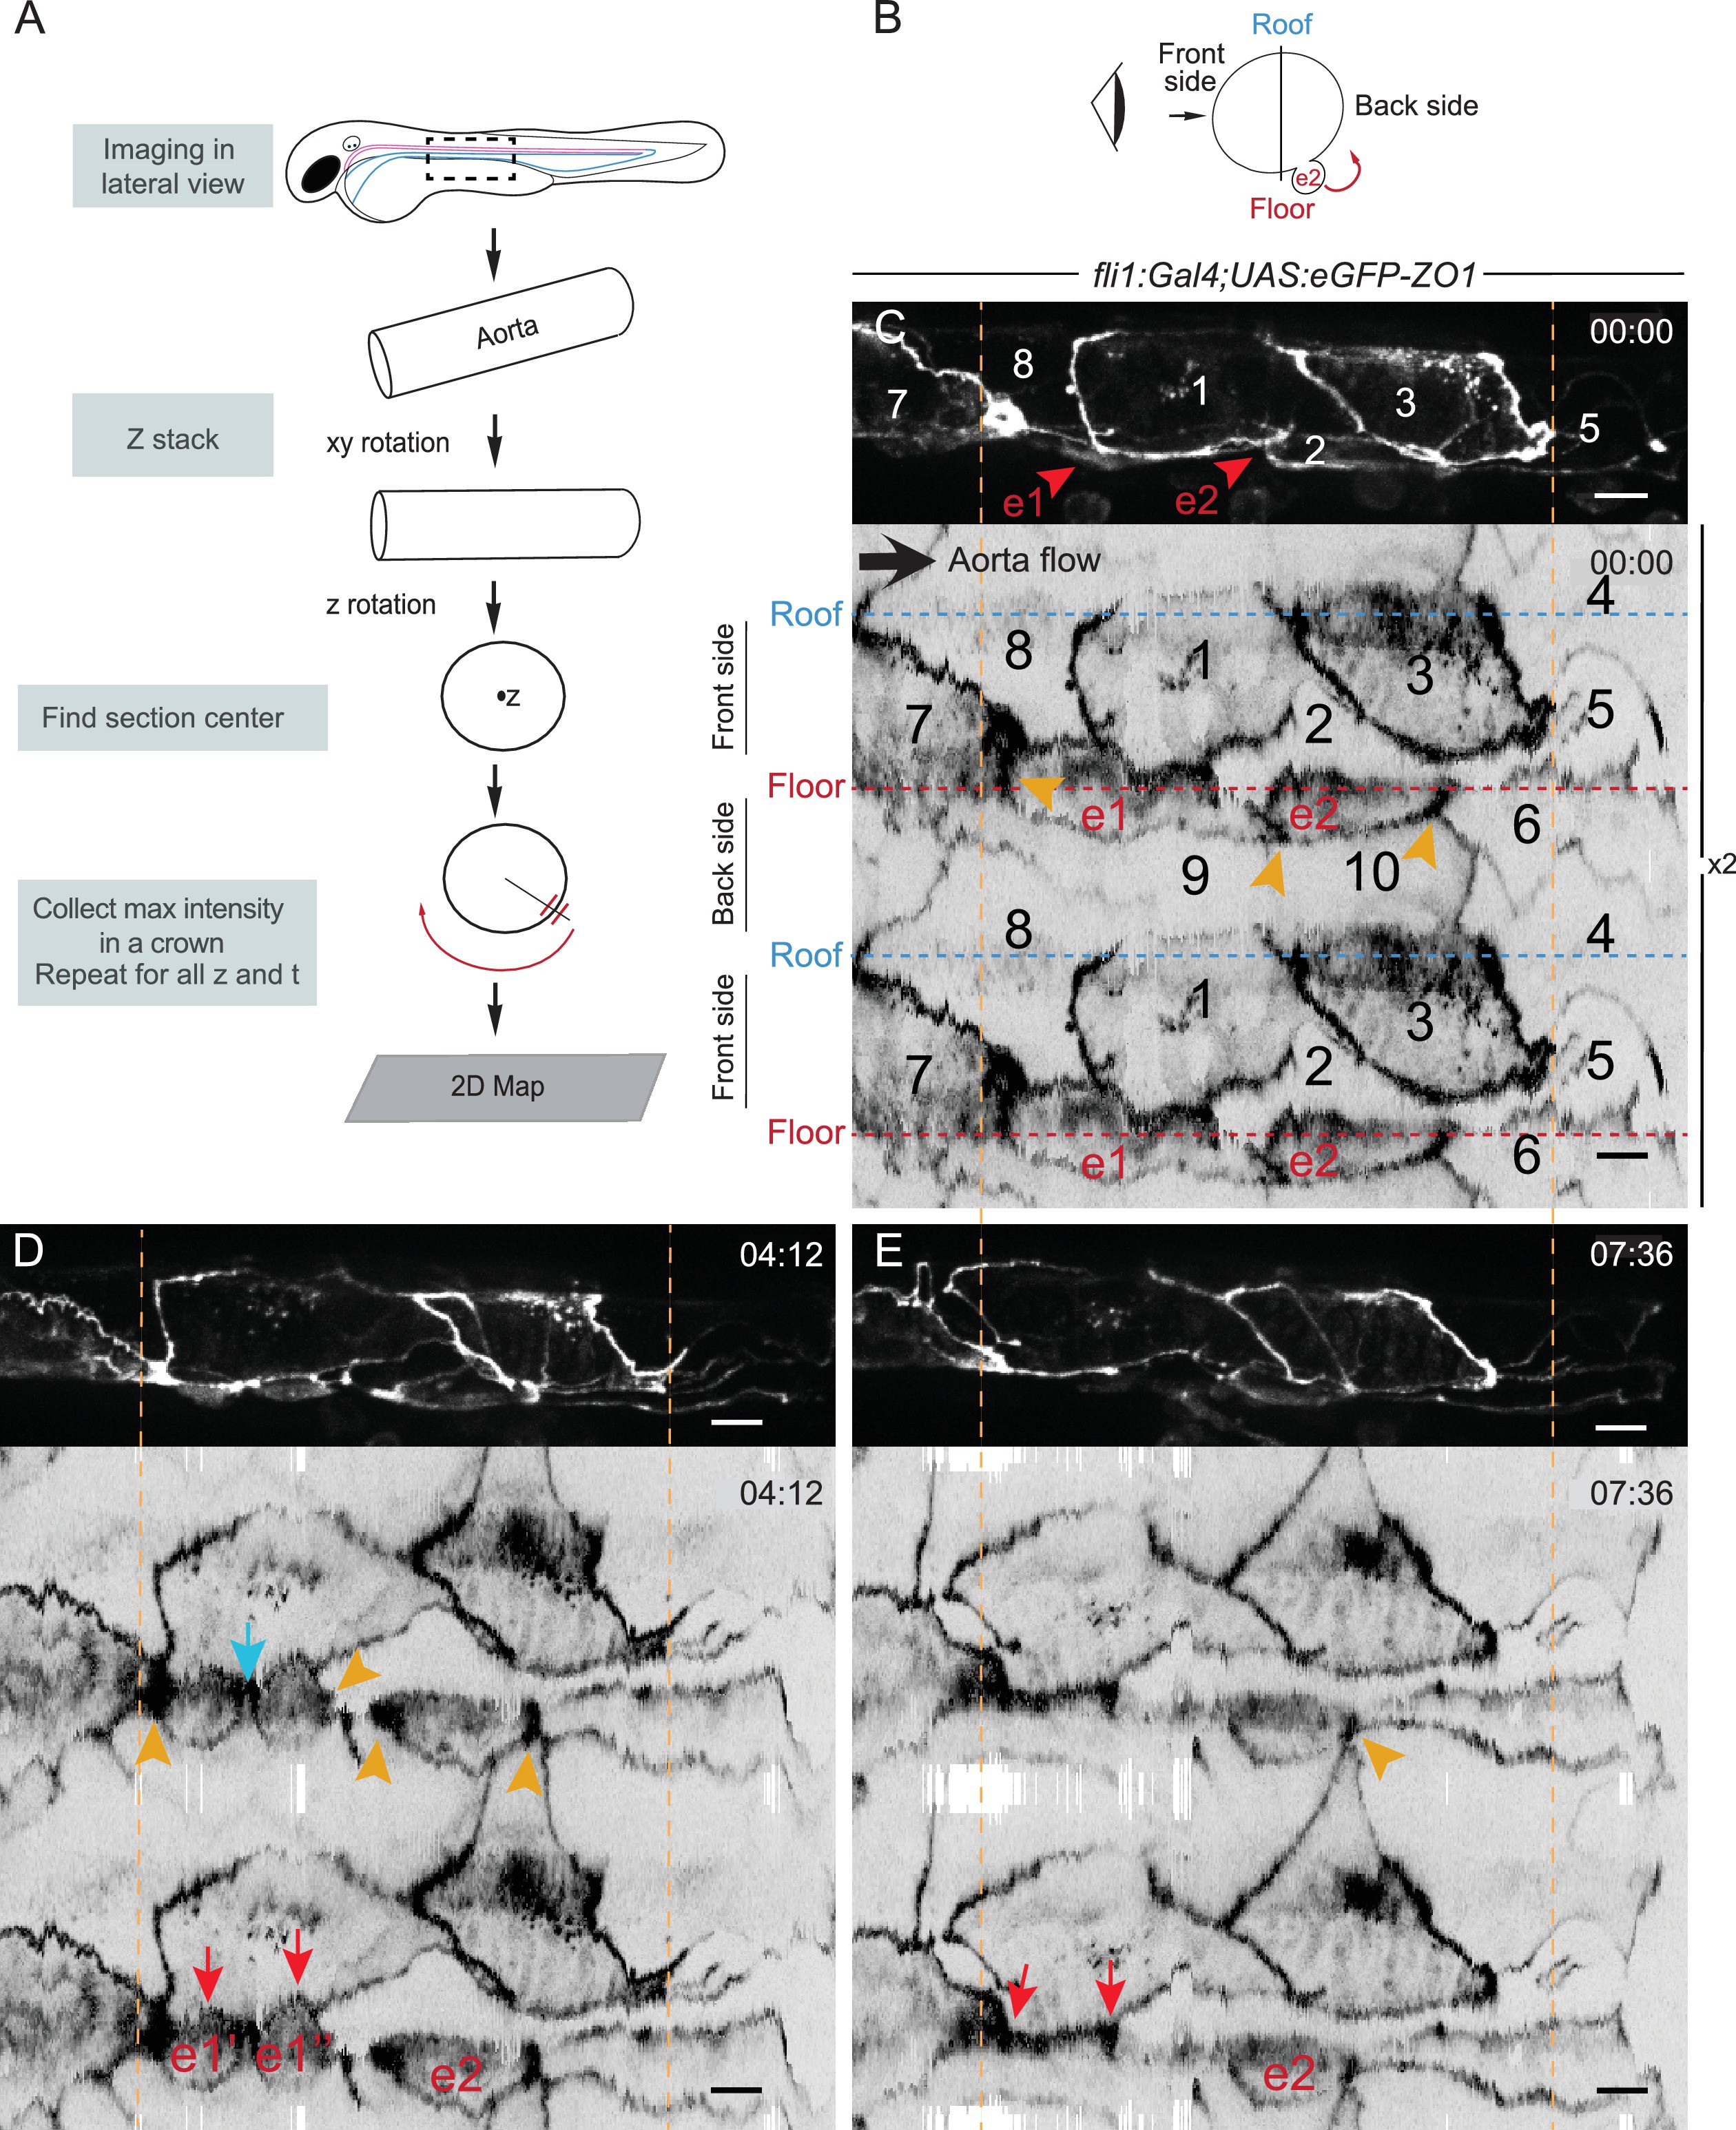
Fig. 3
The EHT cellular landscape unravelled by 2D-projection.
Schematic representations of: (A) Successive steps leading to the 2D projection (see text, Materials and methods and Source code 2), (B) The angle at which the Z-projections in the top panels (C–E) are visualized (eye) and indicating the back-sided exit of the EHT cell e2. (C–E) Top panels are maximum projections of Z-planes extracted from a spinning-disk confocal time-lapse performed on a 48 hpf Tg(fli1:Gal4; UAS:RFP; UAS:eGFP-ZO1) embryo. Bottom panels have been obtained after duplication (x2) of the corresponding 2D-maps (see Materials and methods and Figure 3—video 1). Numbers indicate individual cells. e1, e2: EHT cells (in red, with e1 dividing into e1’, e1’’ by symmetric division, panel D red arrows) are located on the aorta floor. Cells 6, 9 and 10 are exclusively on the backside. All the others span mainly the front side. Yellow arrowheads: Increased density of eGFP-ZO1 at contacting regions between EHT or endothelial cells that are oriented perpendicular to blood flow (antero-posterior axis). Blue arrow: space between the two daughter cells. Note that in panel (E), the daughter cells have emerged (red arrows). Time is indicated in hr:min. Scale bars, 10 μm.