
|
Fig. 1-S1
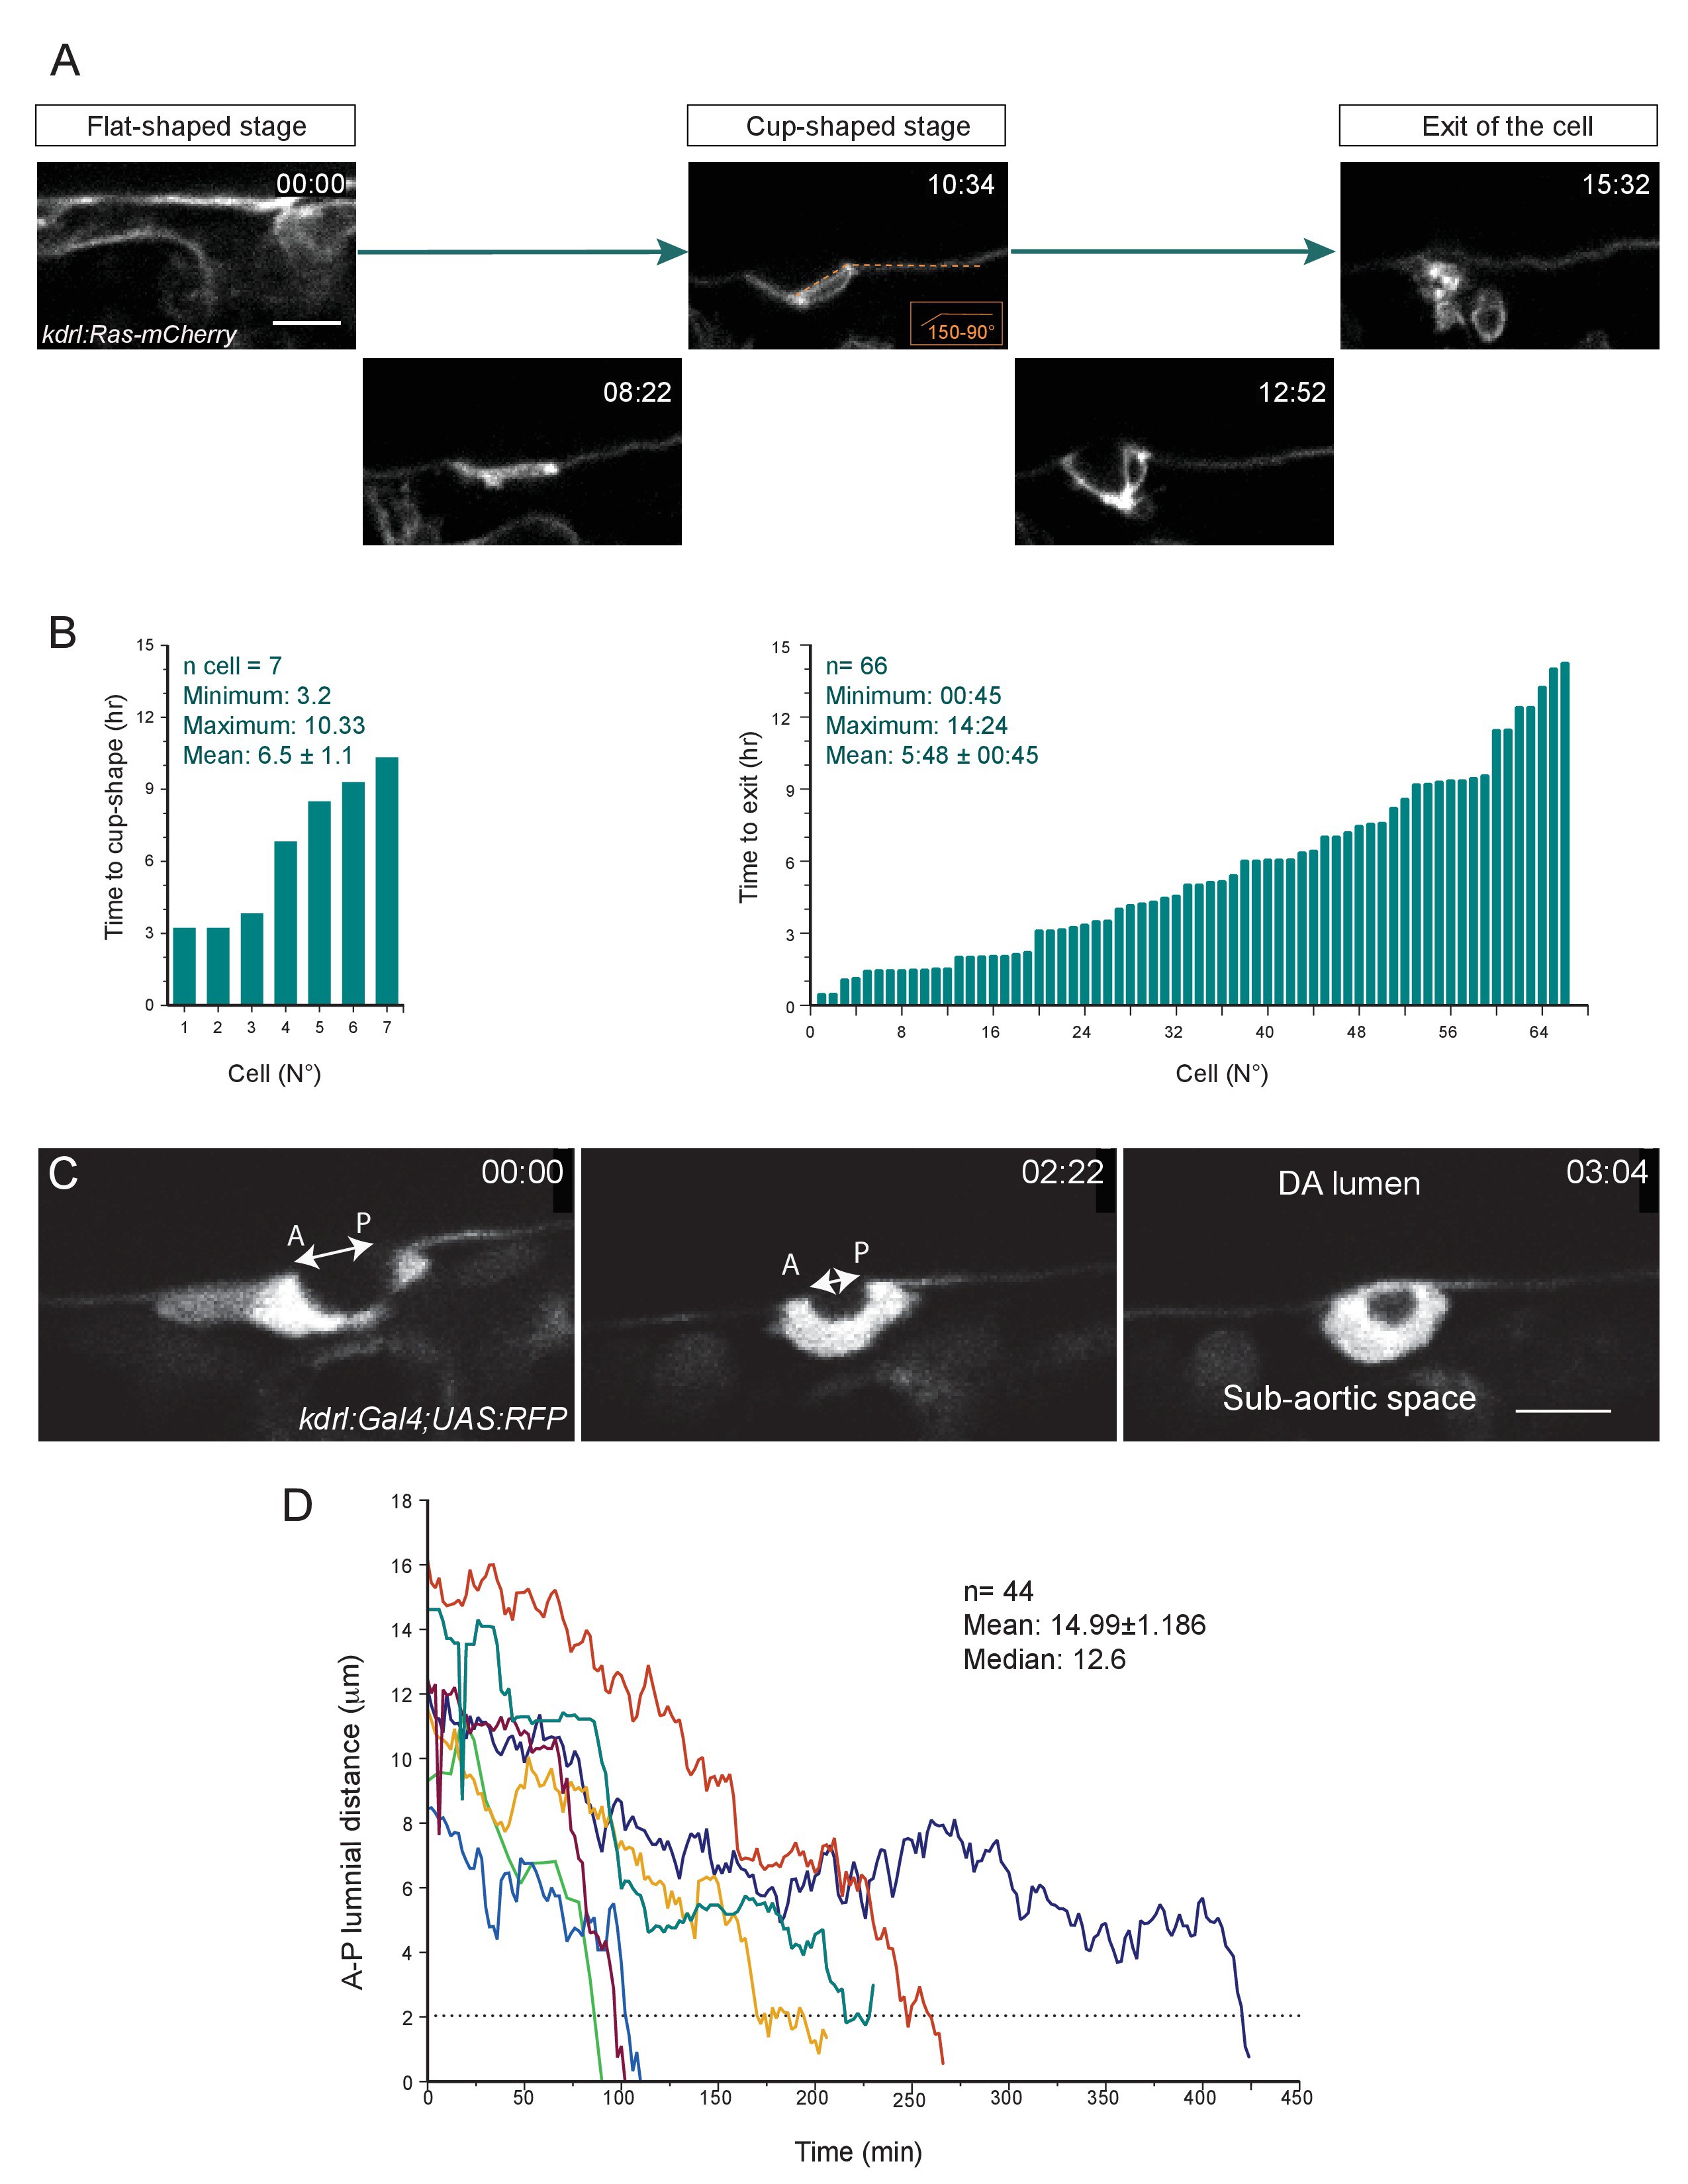
The time-length of the EHT is very heterogeneous (see text also).
(A) Optical sections (Z-planes) extracted from a spinning-disk confocal TL sequence performed on a 48 hpf Tg(kdrl:Ras-mCherry) embryo and showing the progression of the EHT, starting from a flat morphology (the cell is embedded in the hemogenic endothelium, top left panel), followed by the cup-shaped stage (top middle panel) and the emergence (top right panel). Bottom panels show intermediate stages. Time is indicated in hrs:min. (B) Left panel: Time taken by cells to reach the cup-shaped stage, starting from the flat-shaped stage (n = 7 cells). Right panel: Time-to-exit of EHT cells imaged starting at the cup-shaped stage and followed in the 66 TL confocal imaging sequences exploited in this study. See Materials and methods for details. (C) Optical sections (Z-planes) extracted from a spinning-disk confocal TL sequence performed on a 48 hpf Tg(fli1:Gal4;UAS:RFP) embryo, showing a cell undergoing EHT. The double-headed white arrow indicates the Antero-Posterior luminal distance (A-P luminal distance) that separates the two opposite poles of the EHT cell contacting the endothelial neighbors. Time is indicated in hrs:min. Scale bars, 10 μm. (D) Time progression of the A-P luminal distances for seven individual cells (each cell depicted by a specific color). The dotted line highlights the critical A-P luminal distance (approx. 2 μm) beyond which cells rapidly perform their exit.