
|
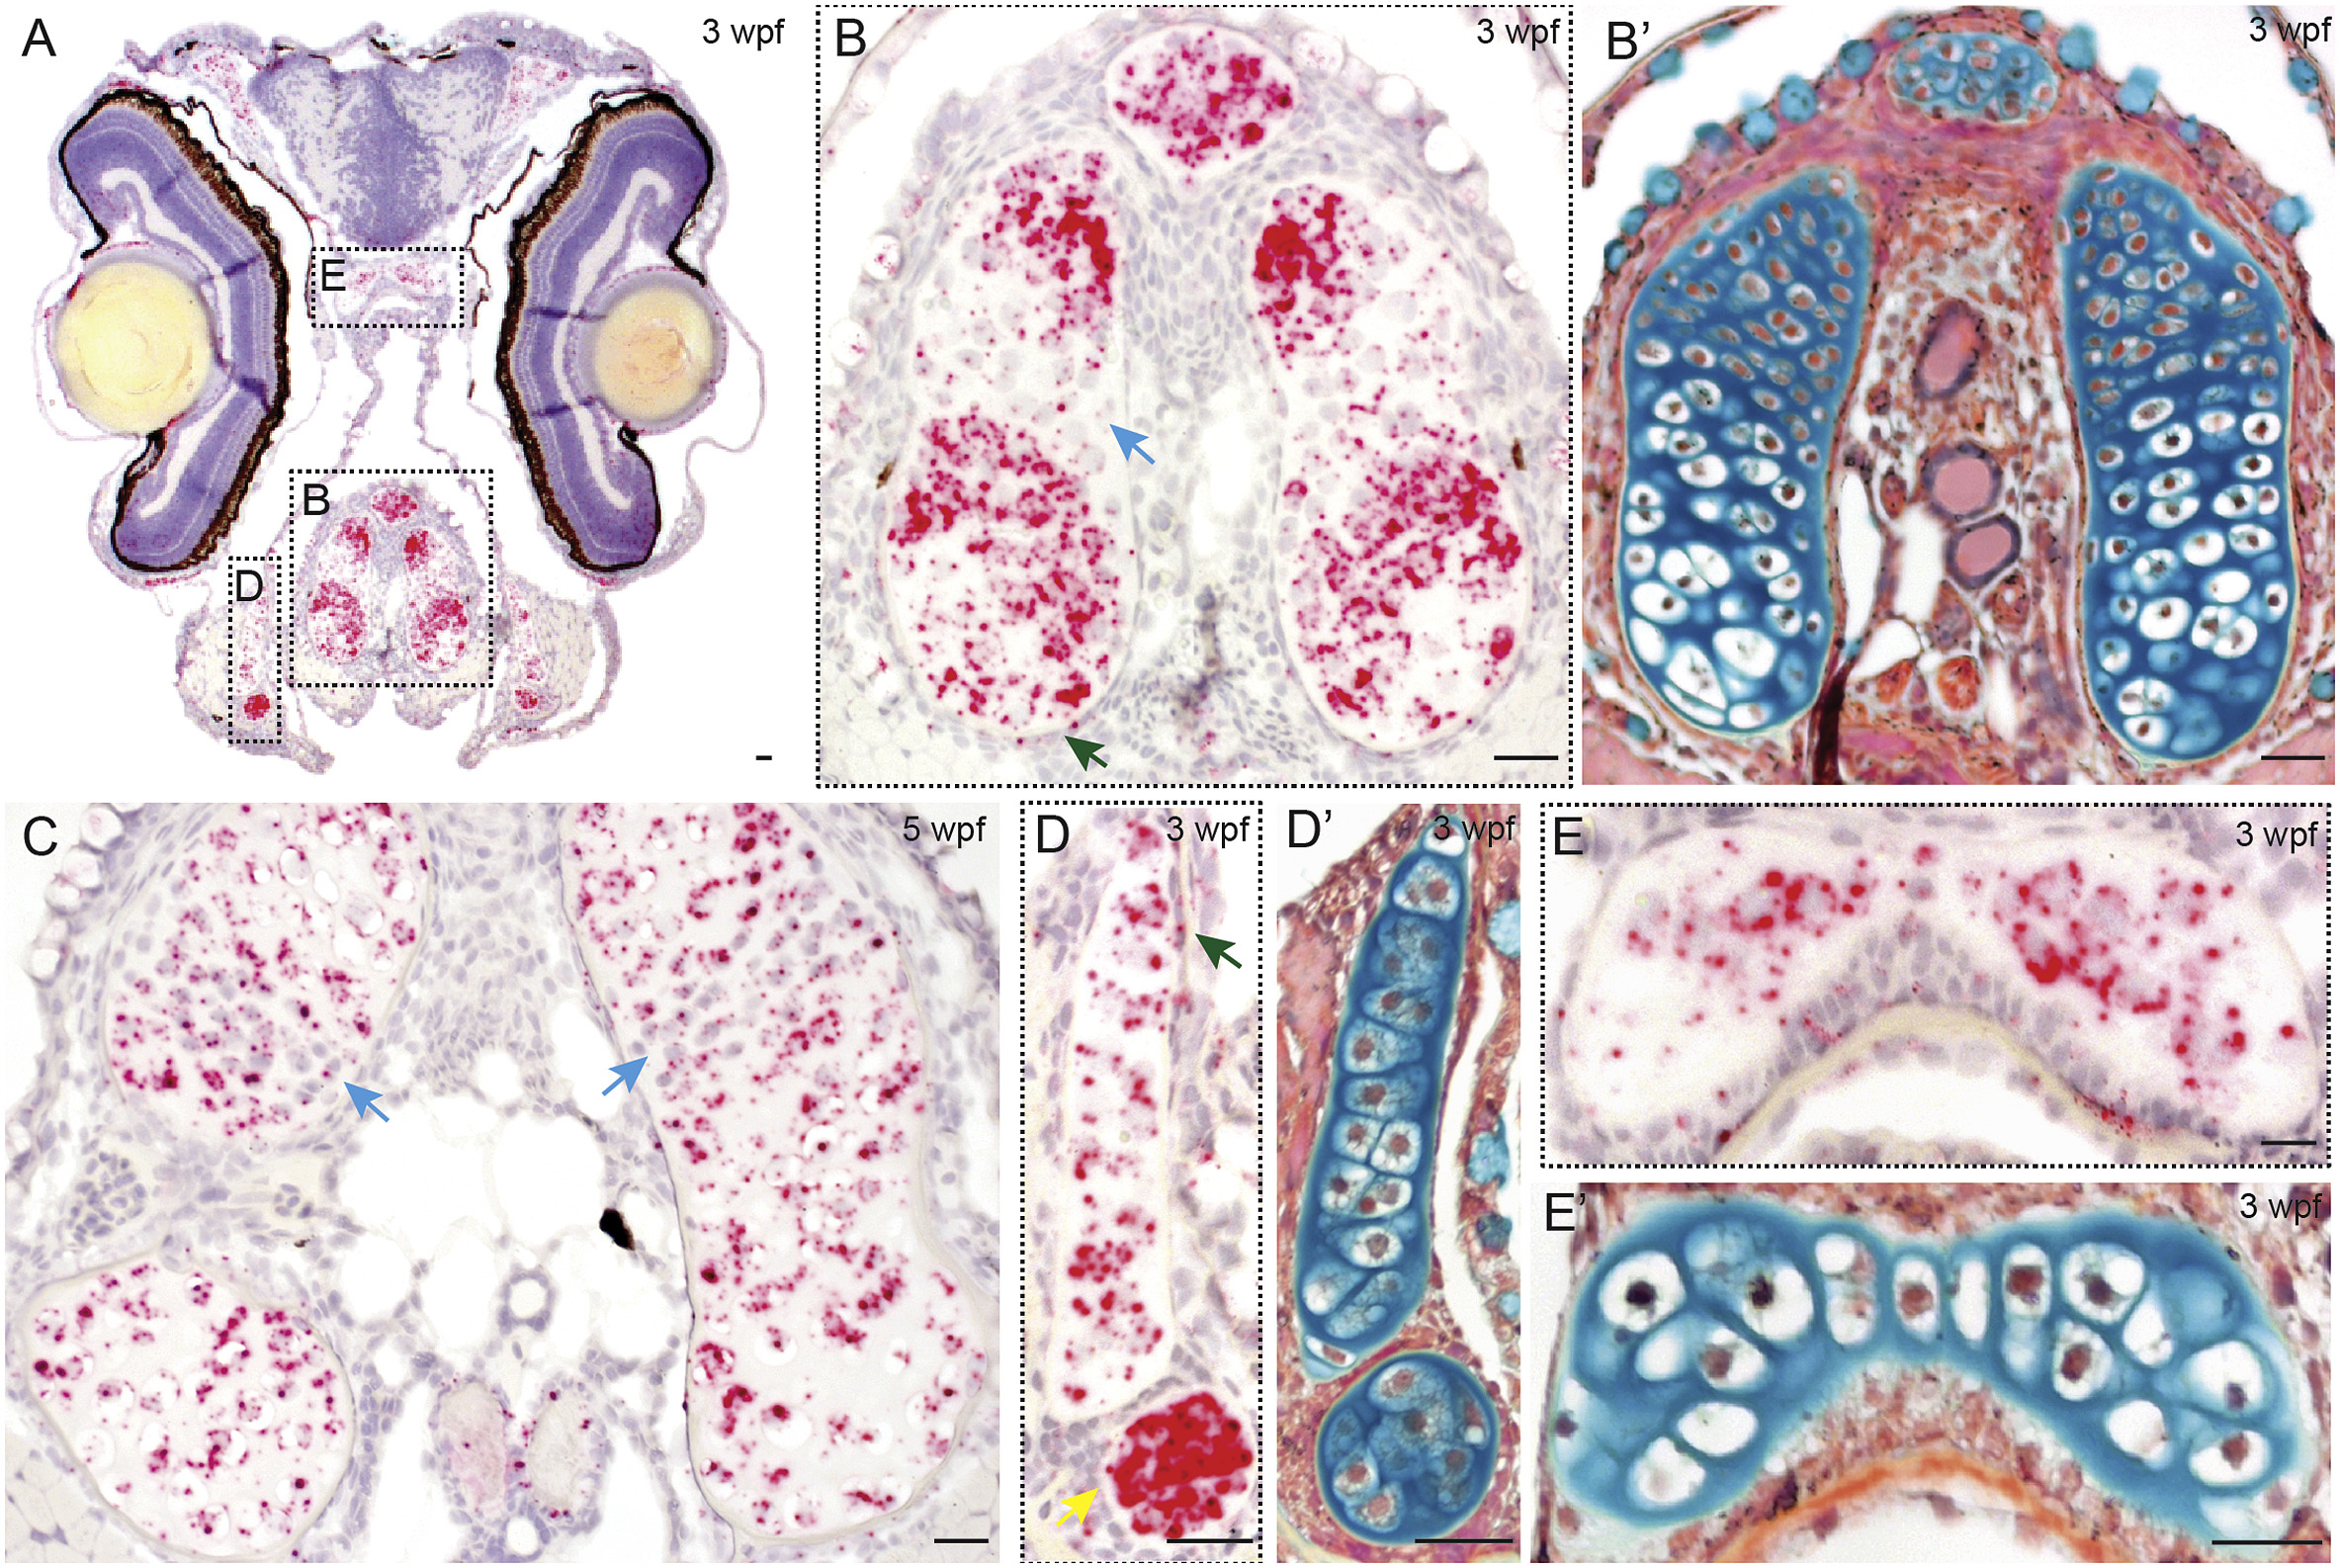
Fig. 1
fgfr3 expression of zebrafish head at the larval stage using coronal paraffin sections. A) Specimen at 3 wpf (SL 8 mm), 5x magnification; B) Higher magnification (40x) of the ceratohyal and basihyal cartilage; B′) The same cartilage stained with pentachrome on adjacent section; C) Basihyal cartilage at 5 wpf (SL 12 mm), 40x magnification; D) Palatoquadrate cartilage at 3 wpf (SL 8 mm), and D′) pentachrome stain, 40x magnification; E) Posterior ethmoid plate at 3 wpf (SL 8 mm), and E′) pentachrome stain, 64x magnification; wpf = weeks post fertilization; green arrows indicate cells staining positive for fgfr3 in the perichondrium; blue arrows indicate proliferative zone. Scale bar = 20 μm.
Reprinted from Gene expression patterns : GEP, 29, Ledwon, J.K., Turin, S.Y., Gosain, A.K., Topczewska, J.M., The expression of fgfr3 in the zebrafish head, 32-38, Copyright (2018) with permission from Elsevier. Full text @ Gene Expr. Patterns