
|
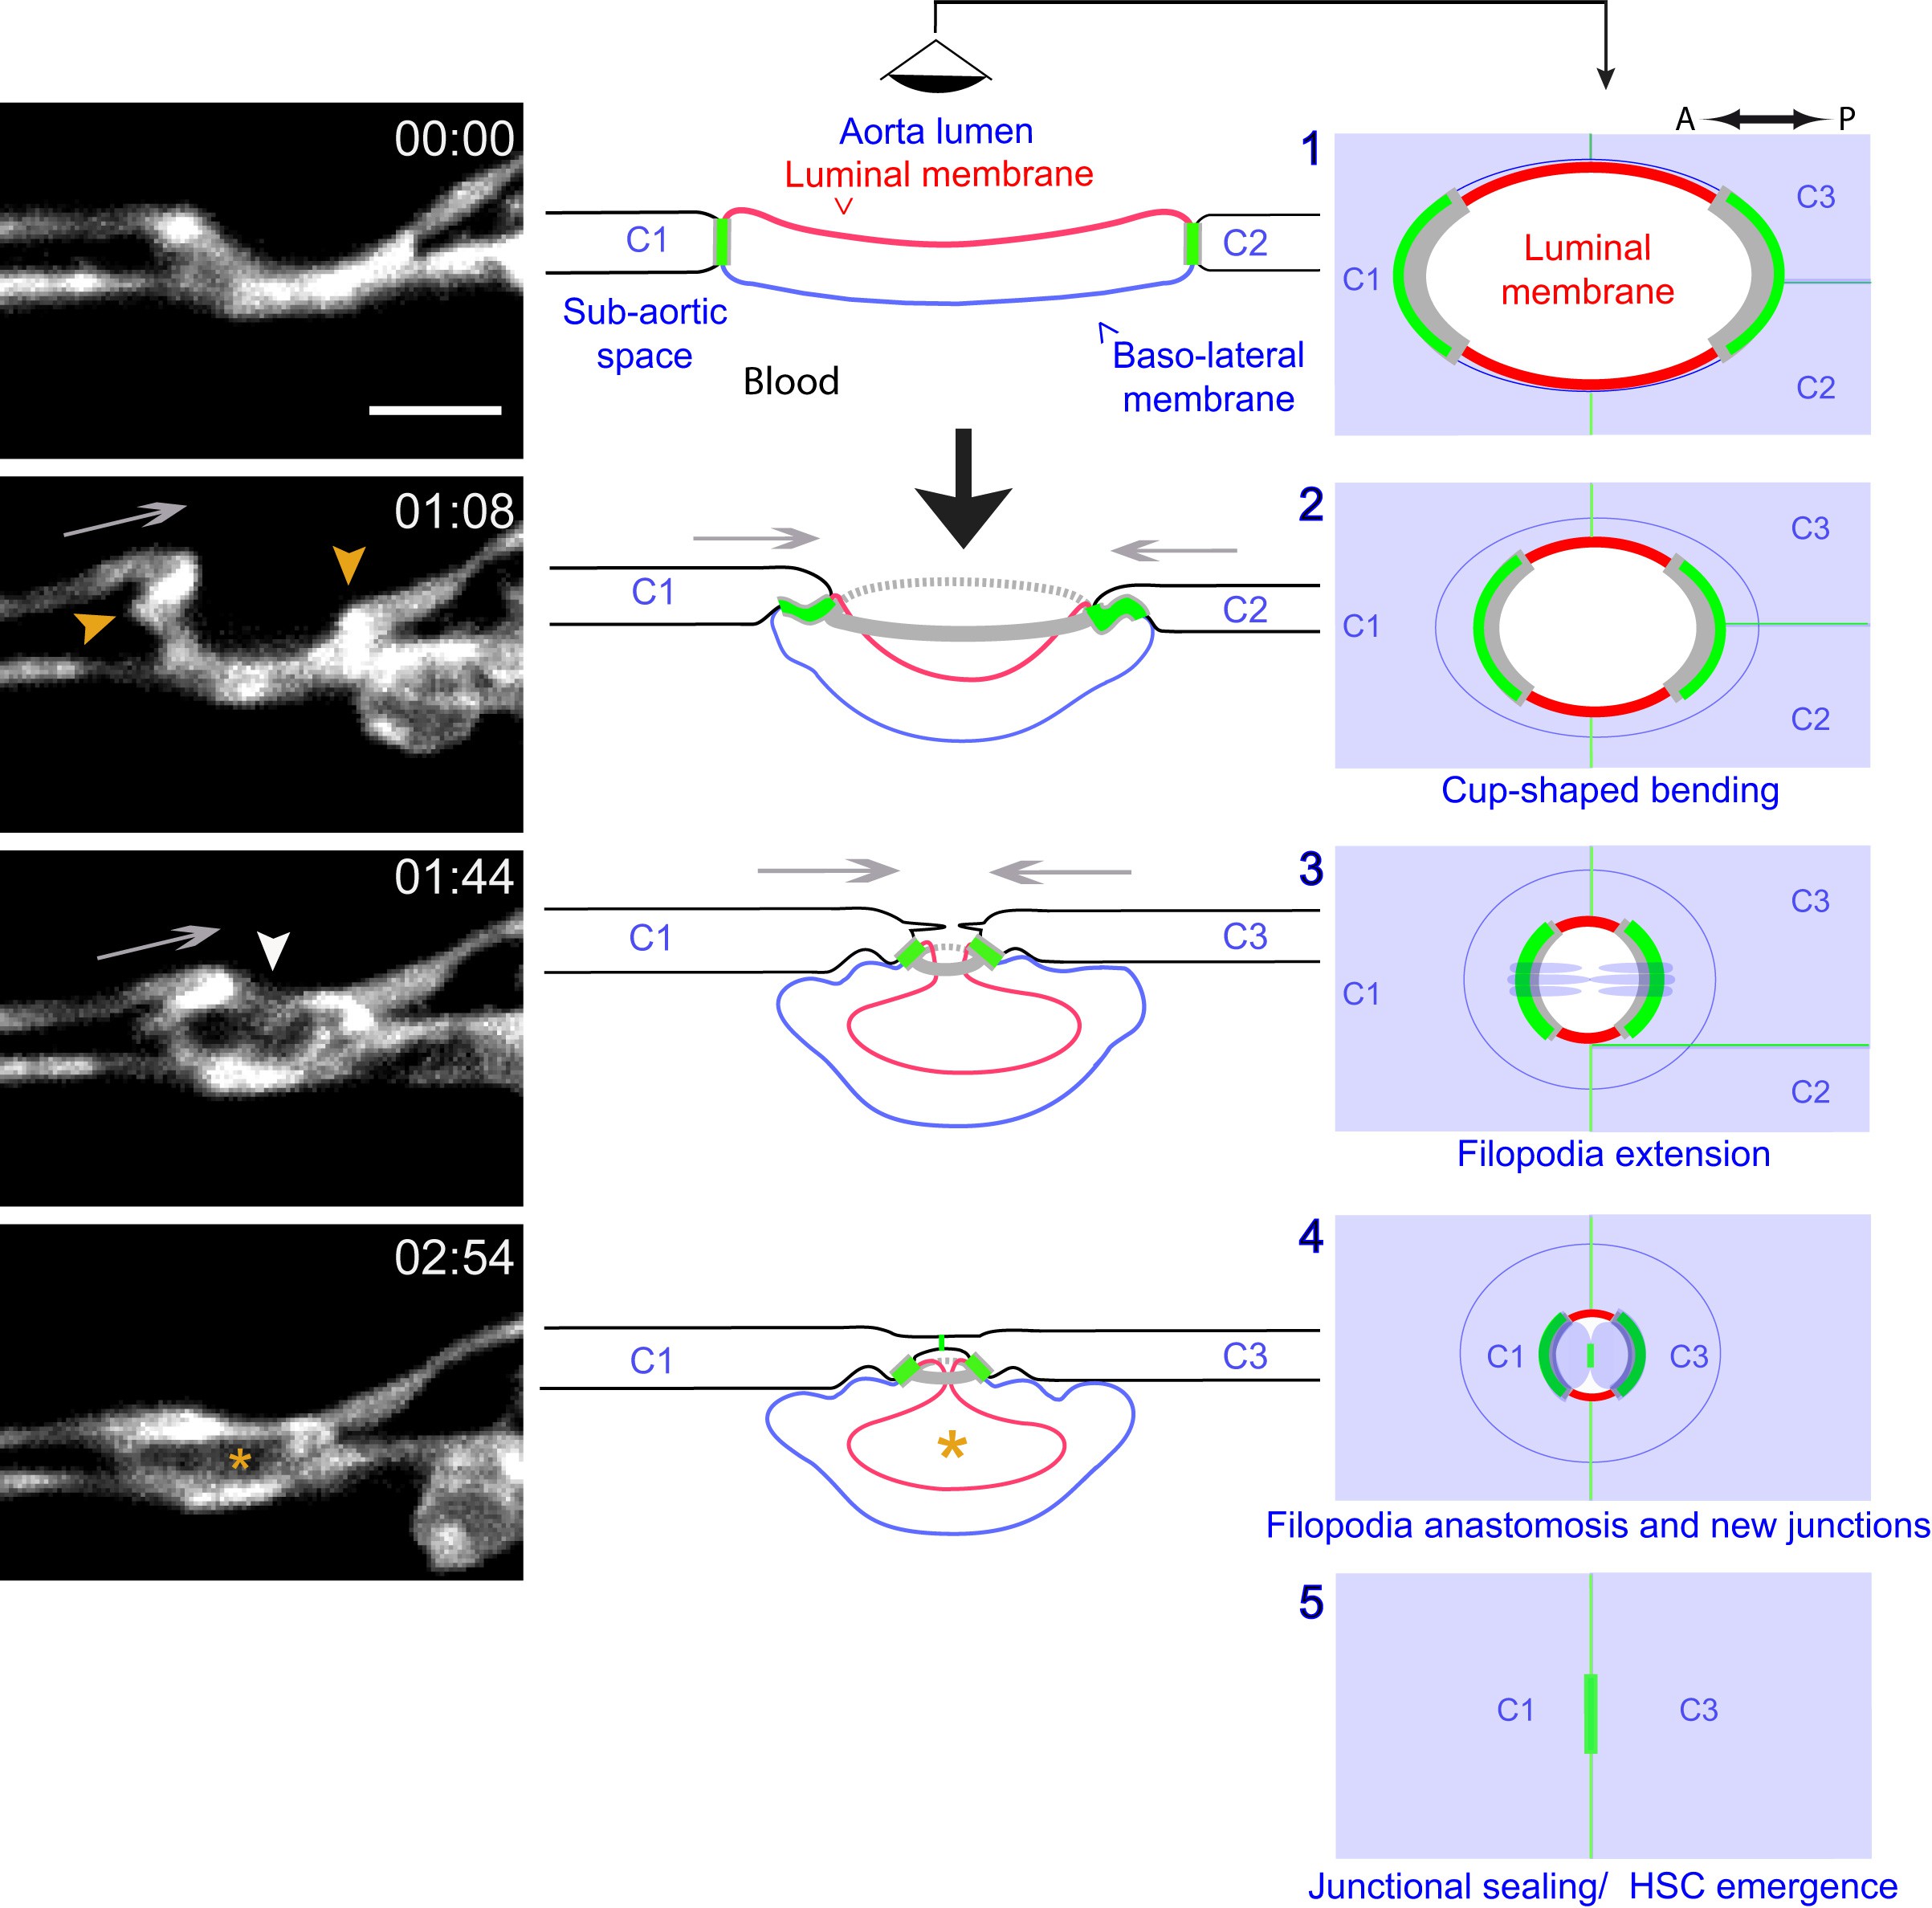
Fig. 7
Modeling of the EHT process.
Left panels: Lifeact-eGFP expressing 48 hpf embryo imaged by spinning-disk confocal microscopy to obtain single Z planes. Images were extracted from Figure 7—video 1. Grey arrows: evidence for the deployment of pushing forces by adjoining endothelial cells. Yellow arrowheads: Lifeact-eGFP densifications. White arrowhead: extension and convergence of filopodia hypothetically emanating from an endothelial cell. Asterisk: intracellular cavity resulting from invagination of the luminal membrane. Middle and right panels (lateral views and ‘en face’ views (with the eye positioned in the aorta lumen)): schematic drawings representing five sequential steps of the EHT deduced from the localization of eGFP-ZO1 (green lines: junctional interfaces), Ras-mCherry (red and blue: luminal and basal membrane, respectively), Lifeact-eGFP (grey, F-actin circumferential belt. Note that the junctional circumferential belt is not drawn for simplicity). Grey arrows: putative pushing forces deployed by adjoining endothelial cells. Black arrow: hemodynamic force (perpendicular to the aortic plane). Note that in the ‘en face’ views, the luminal membrane should appear as a red surface (depicted by red lines only), and that the circumferential junctional and F-actin belts are only depicted at their sites of increased density, that is membrane interfaces at the A-P poles of the EHT cell, bound by tricellular junctions oriented perpendicular to blood flow, as revealed by 2D-maps. See the main text for additional comments. C1-C4: adjoining endothelial cells. Time is indicated in hr:min. Scale bar, 10 μm.