
|
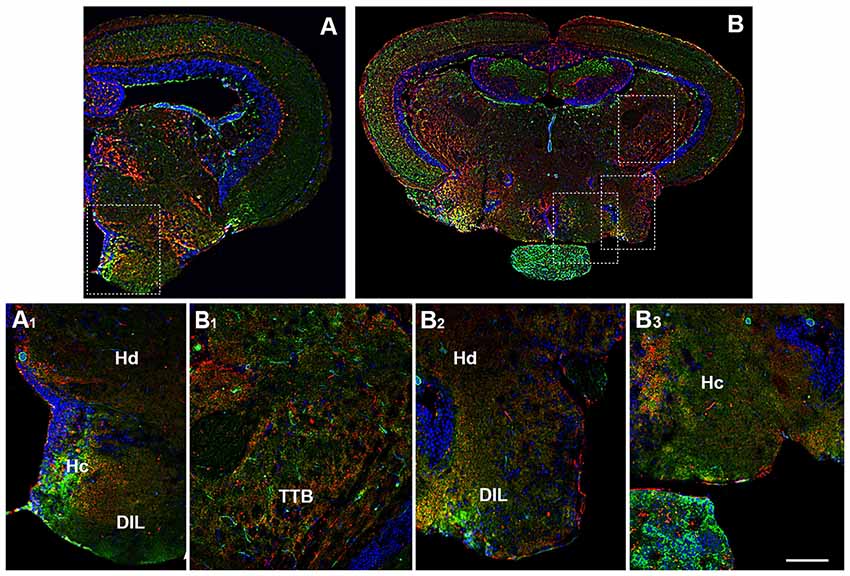
Fig. 5
Distribution of OX-2R (red) and CB1R (green), and their co-localization OX-2R/CB1R (yellow) in coronal sections of diencephalon/mesencephalon. (A,B) OX-2R/CB1R co-expression has been observed in the dorsal (Hd) and central (Hc) zone of the periventricular hypothalamus, DIL and TTB. (A1) Higher magnification of the field boxed in (A) showing the OX-2R/CB1R co-expression within the Hc, Hd and DIL. (B1–B3) Higher magnification of the fields boxed in (B) showing the OX-2R/CB1R co-expression within the TTB (B1), Hd and DIL (B2), Hc (B3). DAPI (Blue) was used as a counterstaining to show nuclei. Scale bar, 250 μm for (A,B); 50 μm for (A1,B1–B3).