
Fig. 8
- ID
- ZDB-IMAGE-180917-33
- Publication
- Nichols et al., 2018 - Ensheathing cells utilize dynamic tiling of neuronal somas in development and injury as early as neuronal differentiation
- All Figures
- Figures for Nichols et al., 2018
|
Fig. 8
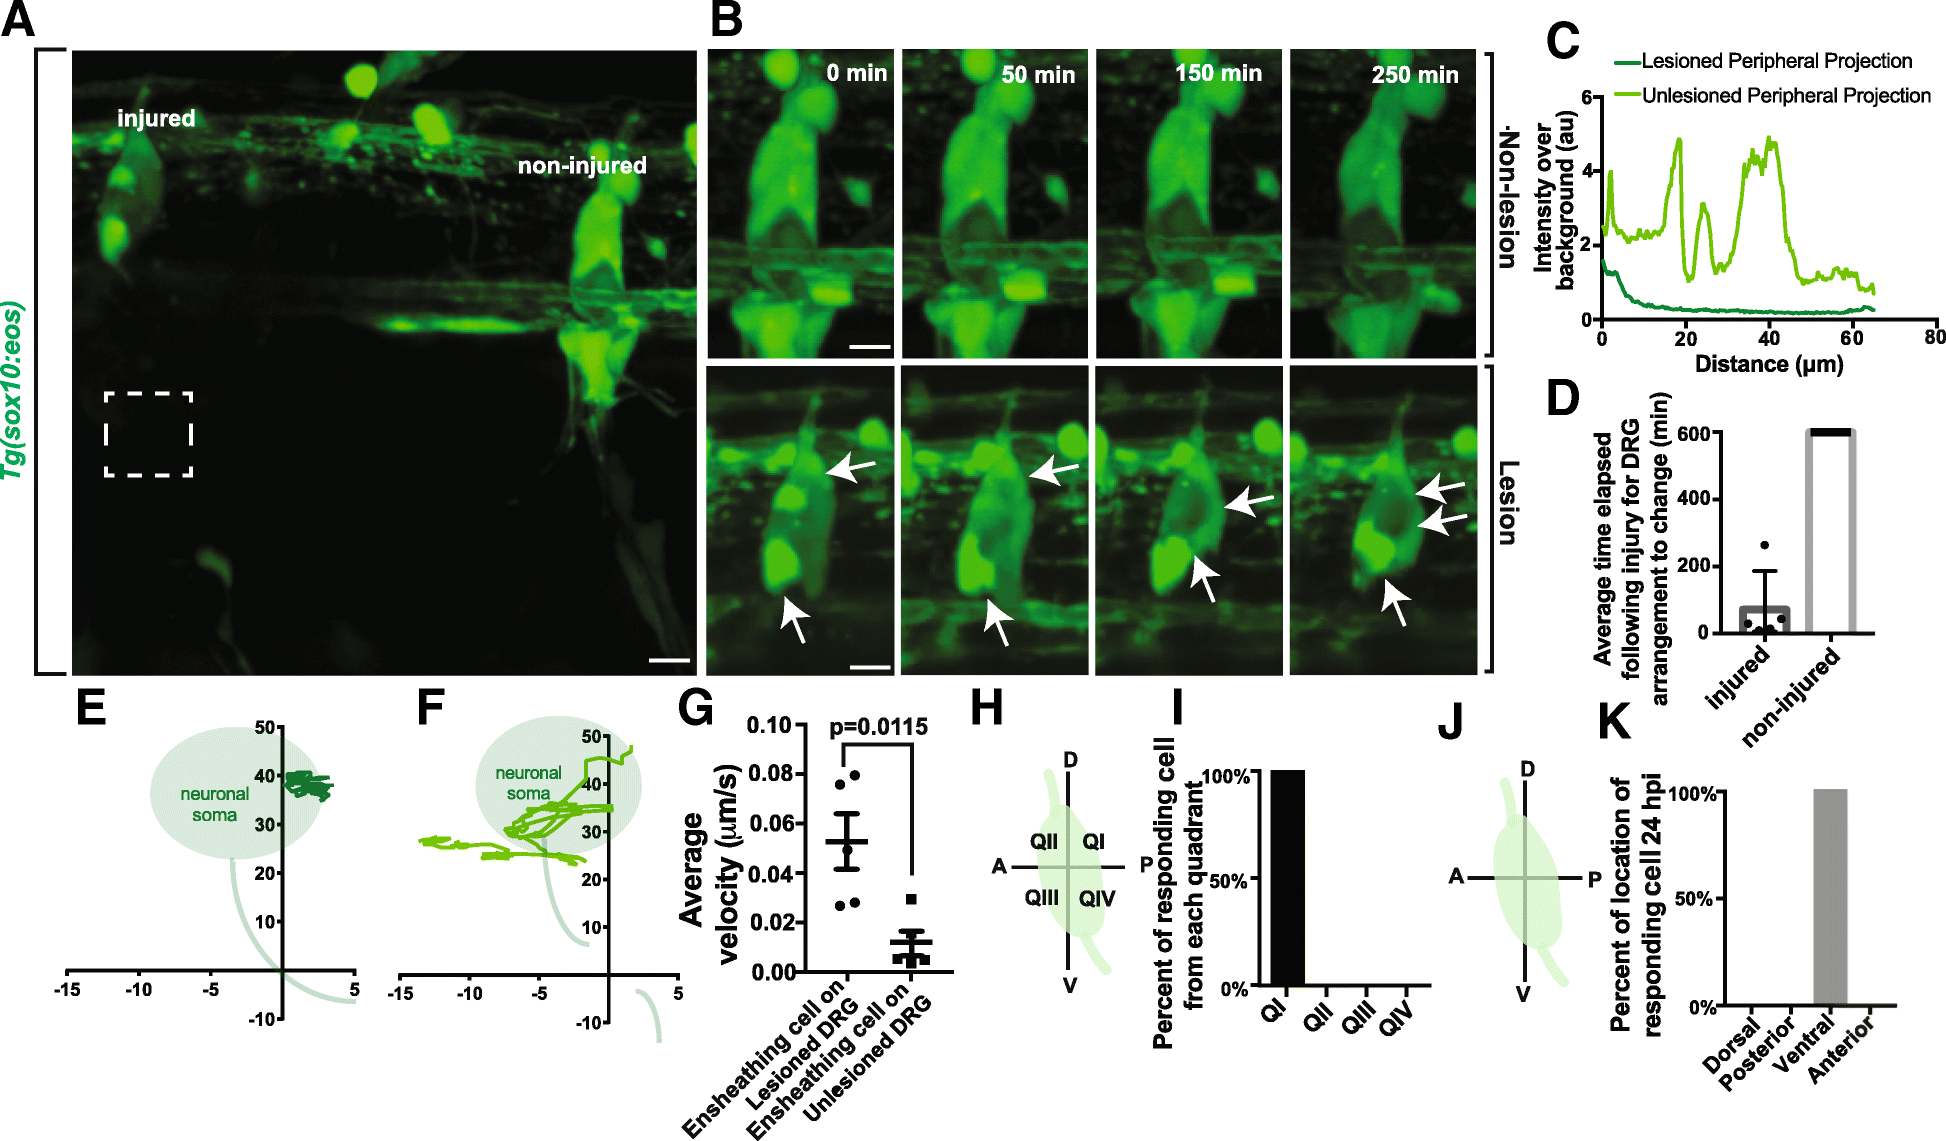
Ensheathing cells respond to peripheral neuronal injury. (a). Confocal z-projection image of a Tg(sox10:eos) zebrafish with a DRG with a peripheral lesion and an adjacent non-lesion DRG. White box denotes site of lesion. (b). Confocal z-projection image of a 24-h timelapse starting at 72 hpf in a Tg(sox10:eos) zebrafish. Top images denote a non-lesion DRG, and bottom images denote a DRG with a peripheral lesion. White arrows denote the movement of ensheathing cells. (c). Intensity profile of lesioned and non-lesioned peripheral axons. (d). Time elapsed after lesion for rearrangement of ensheathing cells in lesioned and non-lesioned DRG (n = 5 lesion DRG, n = 5 non-lesion DRG). (e-f). Plots of ensheathing cells following axonal lesion on non-lesioned (e) and lesioned (f) neurons. Shaded gray areas denote location of the neuron. (0,0) denotes the center of the peripheral axon. (g). Average velocity of ensheathing cells following injury on lesioned and non-lesioned neurons (n = 5 lesion DRG, n = 5 non-lesion DRG). (h). Schematic compass of DRG neuron into quadrants. D denotes dorsal, P denotes posterior, V denotes ventral, A denotes anterior. (i). Percentage of responding cells that originate in each quadrant of the neuron (n = 5 DRG). (j). Schematic compass of DRG neuron by anatomical descriptor. D denotes dorsal, P denotes posterior, V denotes ventral, A denotes anterior. (k). Percentage of responding cells that stabilize in each portion of the neuron (n = 5 DRG). (g) uses an unpaired Student’s t-test. Scale bar is 10 μm (a, b)