
Fig. 6
- ID
- ZDB-IMAGE-180917-31
- Publication
- Nichols et al., 2018 - Ensheathing cells utilize dynamic tiling of neuronal somas in development and injury as early as neuronal differentiation
- All Figures
- Figures for Nichols et al., 2018
|
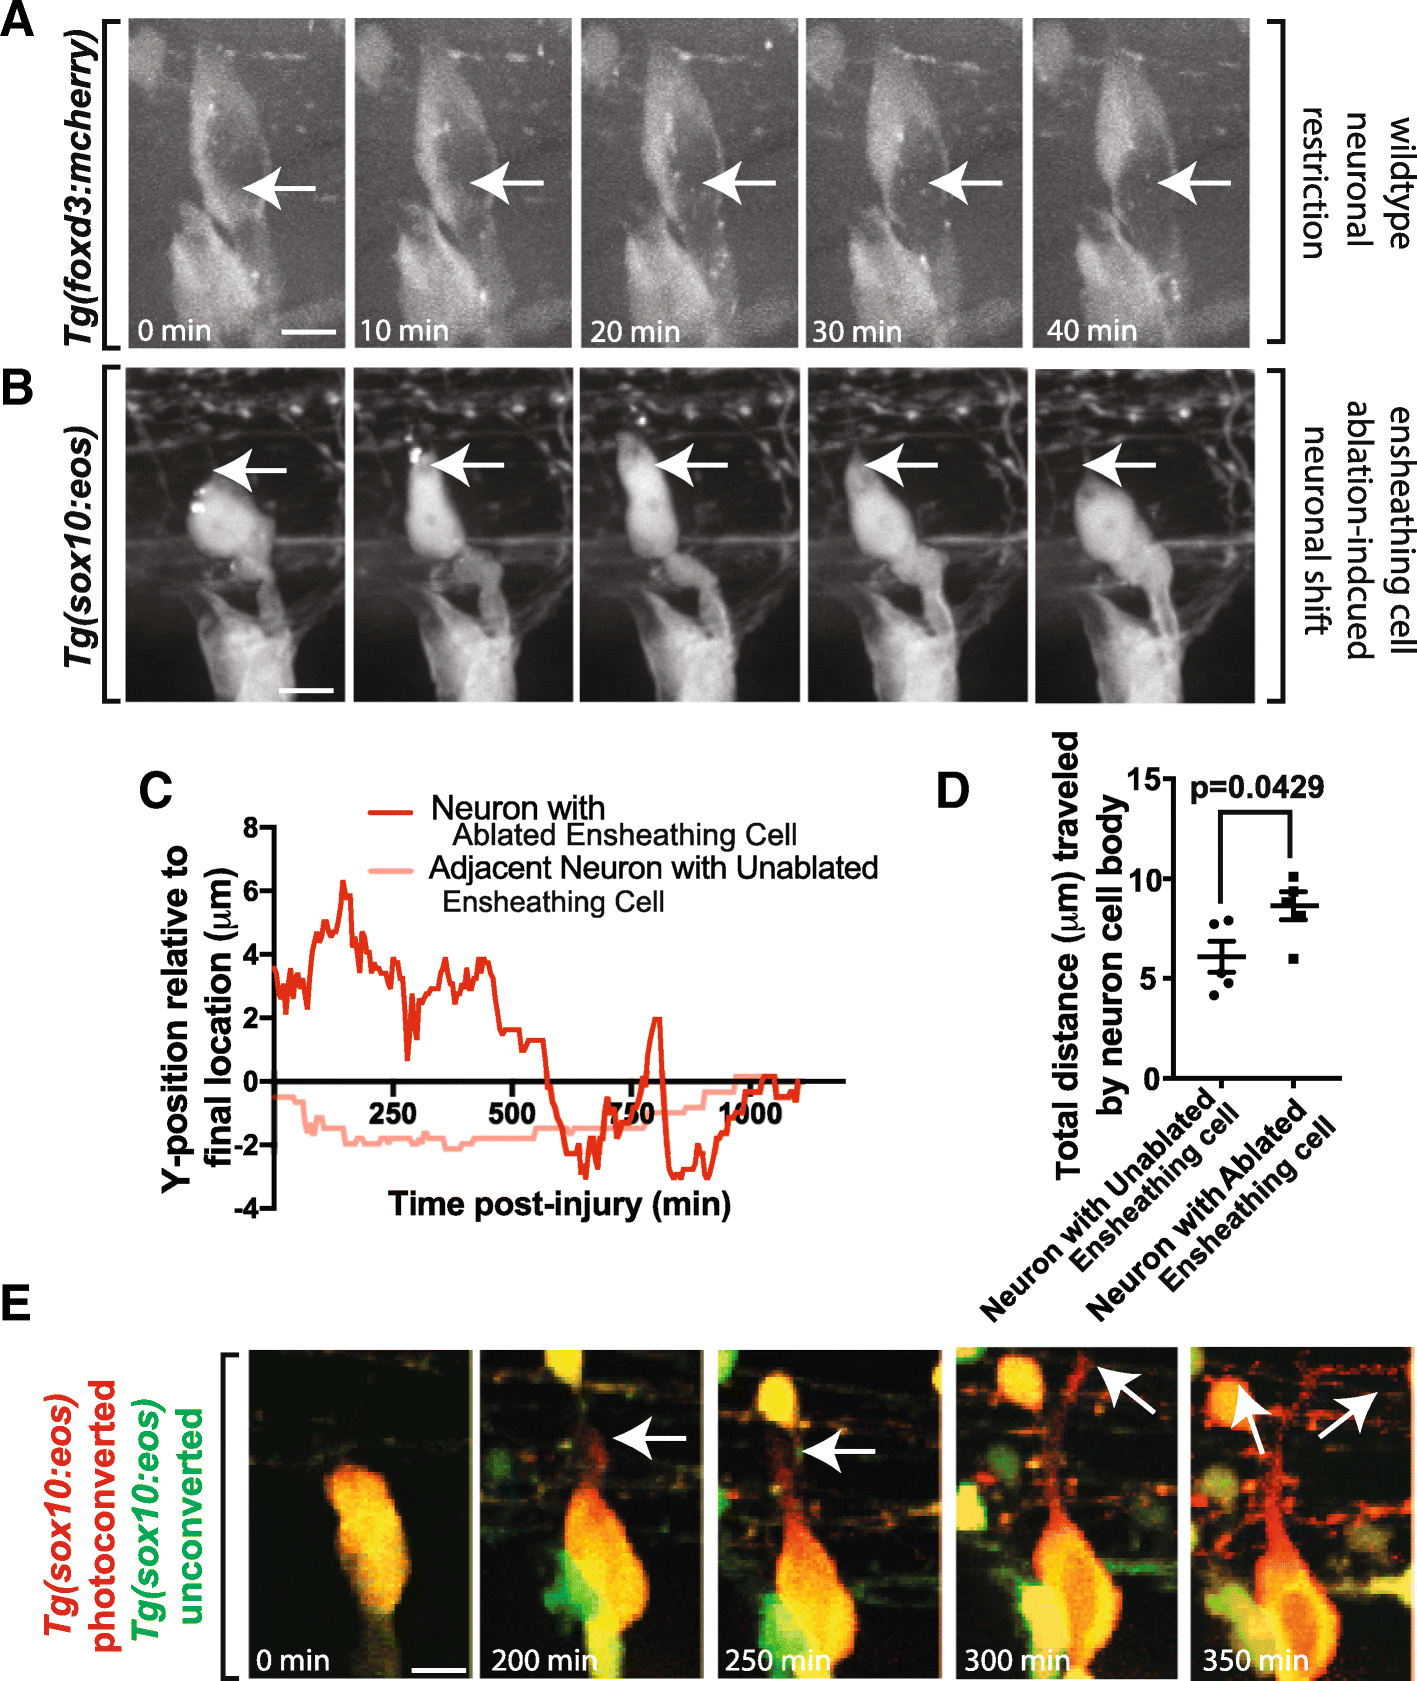
Fig. 6
Extended perturbations of soma-ensheathing cells results in misplaced neurons. (a). Confocal z-projection images from a 24-h timelapse starting at 48 hpf of a Tg(foxd3:mcherry) zebrafish. White arrows denote the center of the neuronal soma. (b). Confocal z-projection images from a 24-h timelapse starting at 72 hpf of a Tg(sox10:eos) zebrafish with a laser ablation of multiple ensheathing cells. White arrows denote the original location of the dorsal apex of the DRG neuron. (c). Change in the y-position over time of a neuron in an ablated and unablated DRG. Y = 0 denotes the final location of the neuronal soma. (d). Total distance traveled by the DRG neuronal soma in an ablated and unablated DRG (n = 5 neurons). (e). Confocal z-projection images from a 24-h timelapse starting at 48 hpf of a Tg(sox10:eos) zebrafish with a photoconverted neuron and ablated ensheathing cell. White arrows denote the migration of the nascent axon. (d) use an unpaired Student’s t-test. Scale bar is 10 μm (a, b, e)