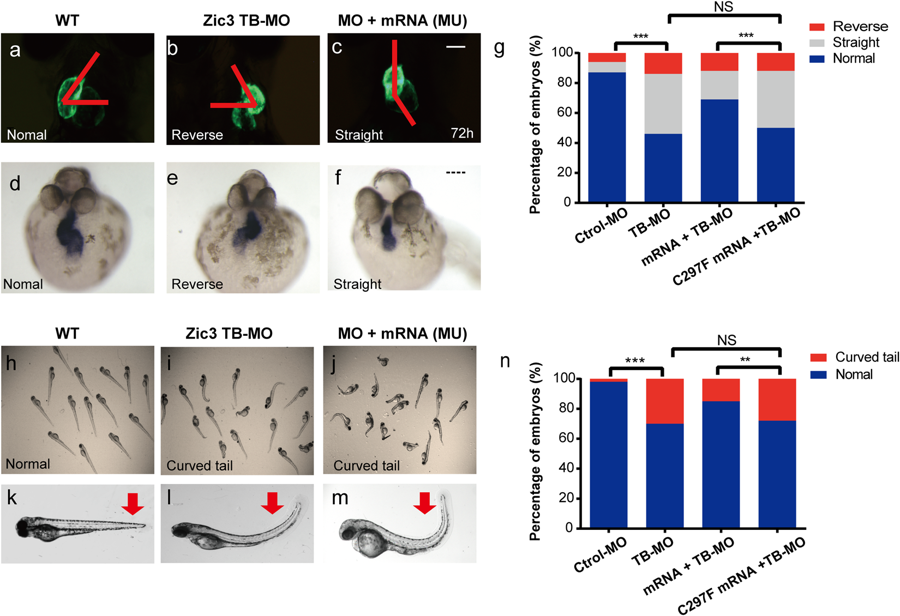
Fig. 4
zic3 knockdown in zebrafish embryos results in laterality defects. (a–c) Wild-type (WT) zebrafish showed normal cardiac looping, while in zebrafish injected with 2.0 ng of the ZIC3 mRNA transcript blocking morpholino (TB-MO) or co-injected 2.0 ng of the TB-MO and 200 pg of mutant mRNA (Mu), the hearts were located at the midline or were reversed. The red line denotes the heart looping angle in normal, midline and reversed hearts. (d–f) In situ hybridization using a heart-specific probe (cmcl2) showed that WT embryos predominantly exhibited normal heart looping. In contrast, heart looping was often observed at the midline or reversed in zic3 TB-MO-injected or mutant rescued embryos. (g) The graph shows the distribution of cmcl2 expression observed in the embryos injected with the control MO (n = 168), 2.0 ng zic3 TB-MO (n = 192), 100 pg ZIC3 (WT) mRNA + 2.0 ng zic3 TB-MO (n = 166), or 100 pg ZIC3 (mu) mRNA + 2.0 ng zic3 TB-MO (n = 232). The WT but not mutant human zic3 mRNA partially rescued the zebrafish heart looping defects. (h–m) In contrast to the WT zebrafish, curly tail was found in the zic3 knockdown zebrafish injected with 2.0 ng of zic3 TB-MO. Furthermore, the phenotypes of the mutant rescued group were extremely obvious. The red arrow indicates the curly tail. (n) The graph shows the distribution of the curly tail phenotype in the Control (Ctrol) MO (n = 254), 2.0 ng zic3 TB-MO (n = 266), 100 pg ZIC3 (WT) mRNA + 2.0 ng zic3 TB-MO (n = 242), and 100 pg ZIC3 (mu) mRNA + 2.0 ng zic3 TB-MO (n = 261) groups. **P < 0.05, ***P < 0.005, NS indicates not significant by Fisher’s exact test. Scale bars: 16X (panel c) and 150 µM (panel f).

