
Fig. 1-S1
- ID
- ZDB-IMAGE-180912-52
- Publication
- Aman et al., 2018 - Wnt/β-catenin regulates an ancient signaling network during zebrafish scale development
- All Figures
- Figures for Aman et al., 2018
|
Fig. 1-S1
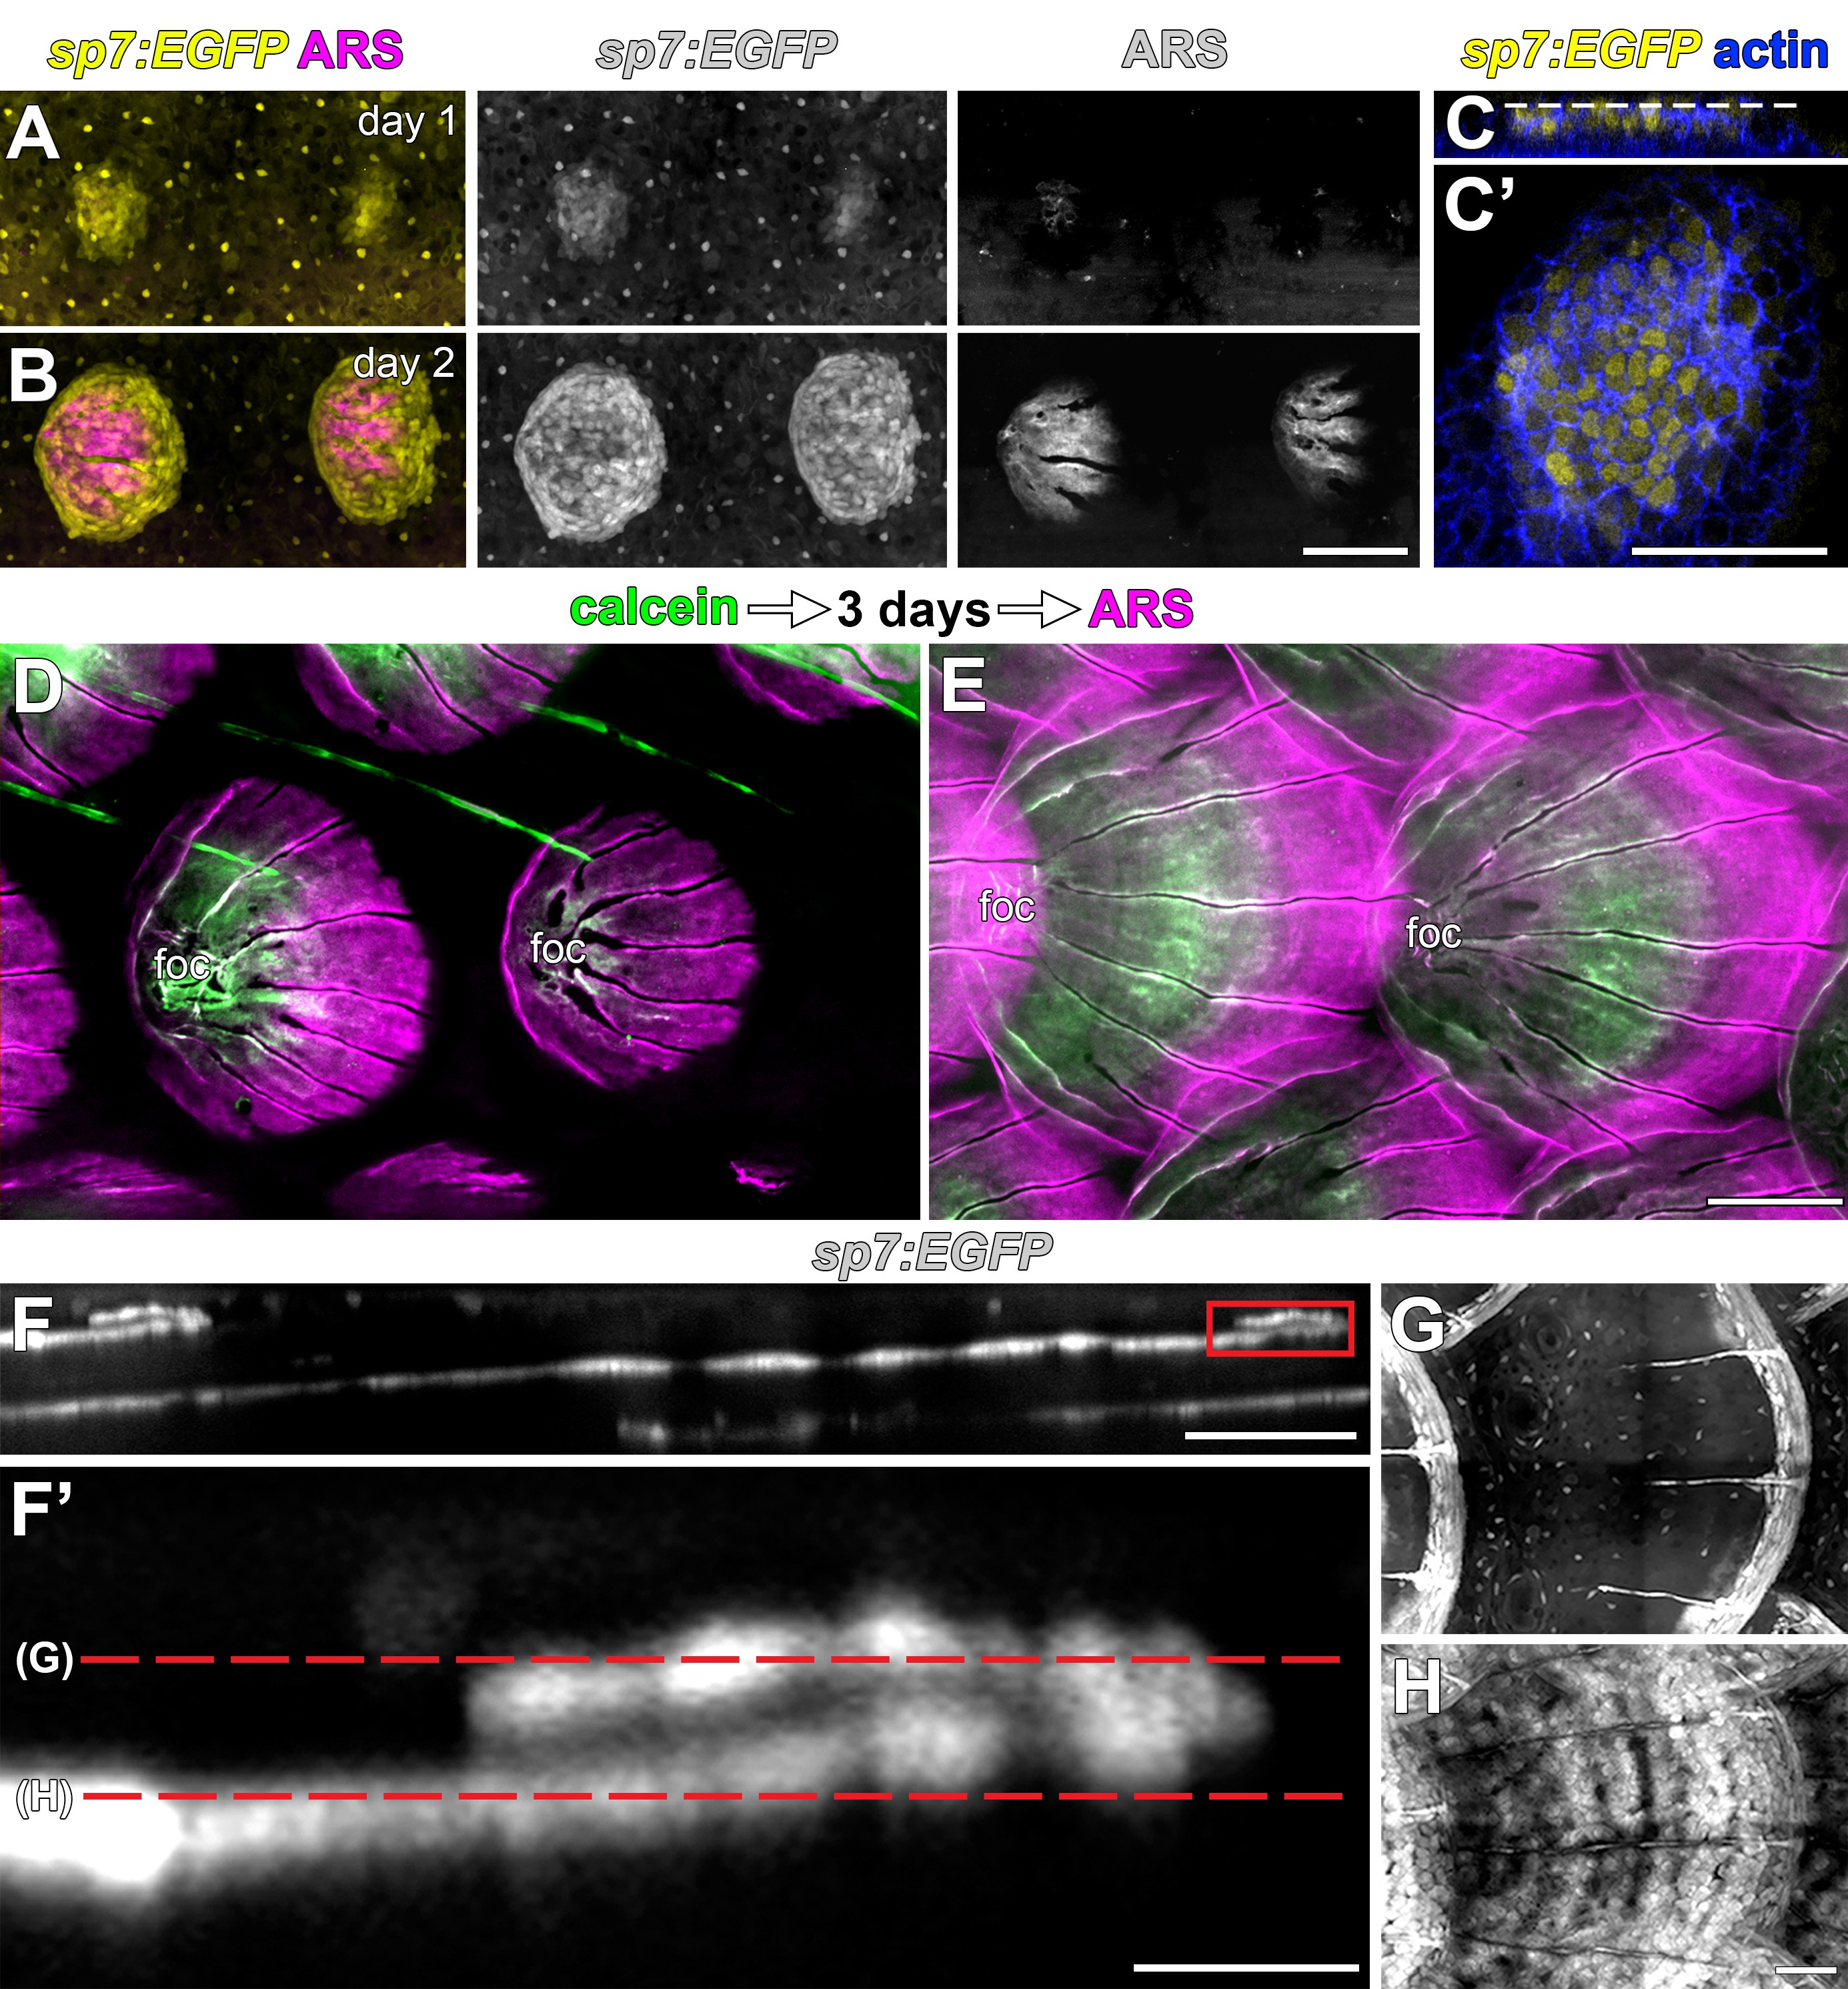
Scales are deposited by sp7:EGFP+ osteoblast like cells.
(A,B) Repeated live imaging of individual larvae revealed that calcified matrix, detected by Alizarin Red S (ARS) labeling (magenta) follows appearance of sp7:EGFP+ osteoblast like cells (yellow). (C,C’) Prior to initial ARS detection, sp7:EGFP+ scale forming cells were arranged in a bi-layered papilla. Phalloidin counter stain (blue) shows cell outlines. (D,E) Sequential labelling with calcein (green) and ARS (magenta) show that scales grow posteriorly from the initial center of calcification, which is retained as the scale-focus (foc). (D) Calcein labelling from initial scale formation. (E) Extending scales. (E–H) Osteoblast like cells are arranged in a monolayer along the deep aspect of the mature scale and loop around to cover the superficial aspect of growing posterior margin (boxed area in E). Scale bars, 100 µm (A, B, D, E); 50 µm (C, C’, F, G, H); 10 µm (F’).